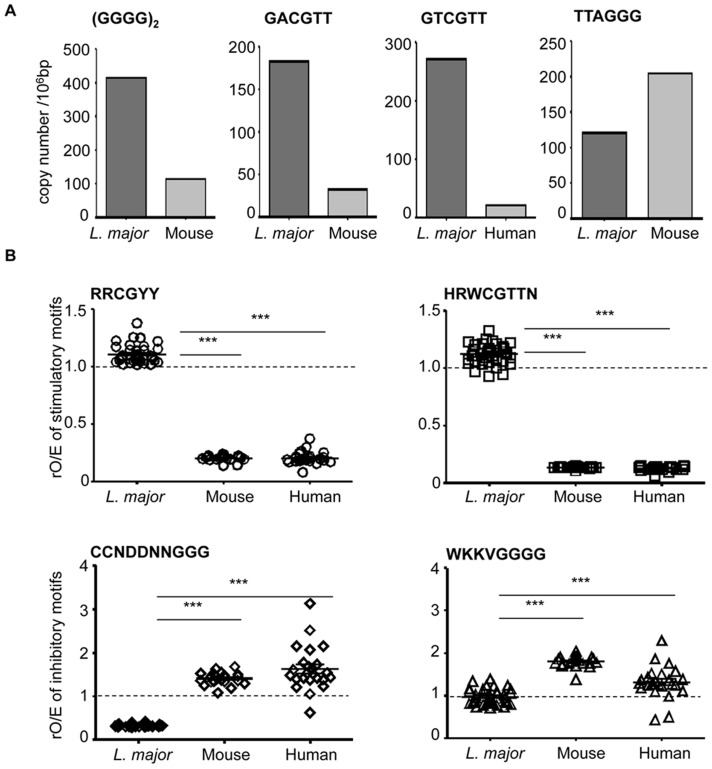
Figure 6. Selection for inhibitory and against stimulatory TLR9 motifs in vertebrate genome.
(A) Poly G8 (GGGG)2, stimulatory GACGTT and inhibitory TTAGGG motifs were quantified in L. major and mouse genomes. Stimulatory GTCGTT motif was quantified in L. major and human genomes. The datas are represented as copy number per 106 bases pair ( = copy number/genome size (bp)*106). (B) Stimulatory (RRCGYY and HRWCGTTN) and inhibitory (WKKVGGGG and CCNDDNNGGG) motifs were quantified in each L. major, mouse or human chromosome. They are represented as the ratio of observed/expected sequences rO/E, as indicated in Table 1. For each chromosome, the ratio is represented by a single symbol. Significant differences between L. major and vertebrate chromosomes are indicated (***, p<0.001). The dotted line represent the ratio of observed/expected rO/E sequences which is 1, when no selection pressure is exerted on the genome in a neutral environment.

