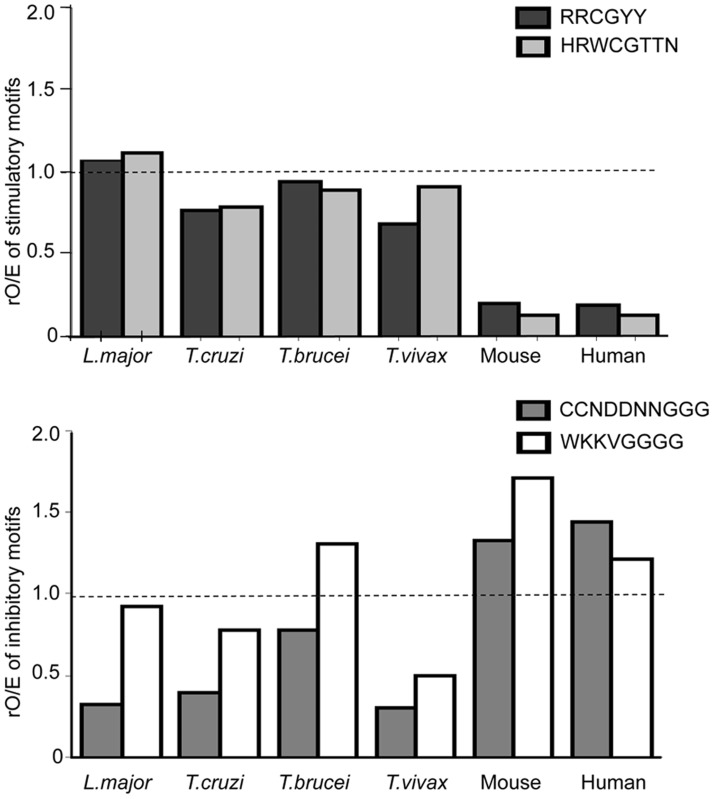
Figure 7. The representation of stimulatory and inhibitory motifs in L. major genome is shared by other Trypanosomatidae genomes.
The data represent the ratio of observed/expected number rO/E for each motif [stimulatory (RRCGYY and HRWCGTTN) or inhibitory (WKKVGGGG and CCNDDNNGGG)] from the analysis of Trypanosomatidae complete genomes (Table 1). The dotted line represent the ratio of observed/expected rO/E sequences which is 1, when no selection pressure is exerted on the genome in a neutral environment.

