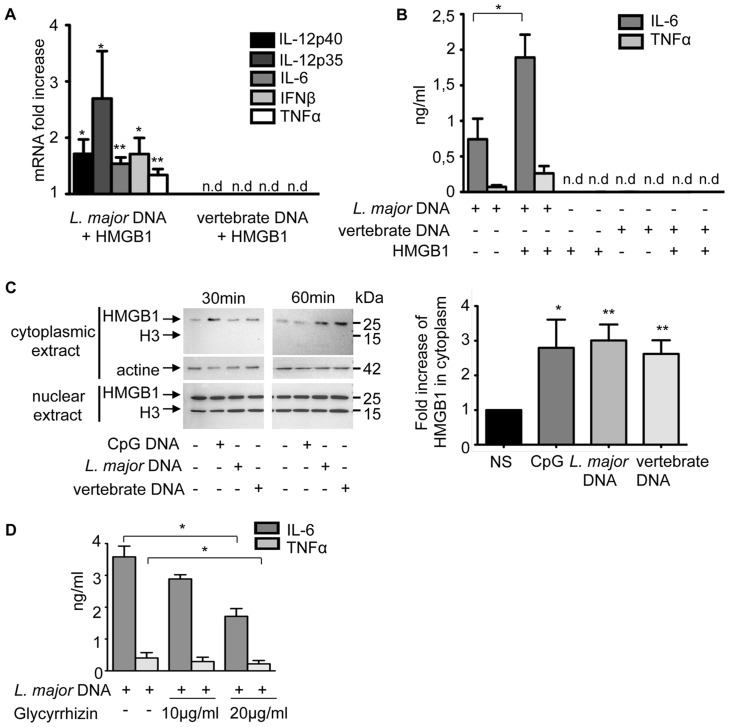
Figure 8. The contribution of HMGB1 to TLR9 activation.
C57BL/6 BMDCs were stimulated with L. major or vertebrate DNA (20 µg) complexed with rHMGB1 (1 µg) or alone (as control and reference) for 6 h. (A) Cytokines mRNA were detected by real-time PCR. The data are expressed as the n-fold increase with the expression in stimulated BMDCs by L. major or vertebrate DNA alone. The mRNA expression levels were normalized to the expression of the HPRT gene. nd: not detectable. (B) IL-6 and TNFα production was measured in supernatants by ELISA. (C) Time-course analysis of HMGB1 in the cytoplasm and nucleus of BMDCs not stimulated (NS) or stimulated by CpG 1826 (1 µg), L. major or vertebrate DNA (20 µg). (left) Analysis was performed by Western Blot at 30 and 60 min post-induction. (right) Quantification of HMGB1 in cytoplasmic extracts was normalized to that of actin and expressed as the n-fold difference with the unstimulated BMDCs. The mean and SEM of six independent experiments, each including both 30 min and 60 min extracts, is represented by the histogram. (D) C57BL/6 BMDCs were stimulated with L. major DNA alone (20 µg) or with glycyrrhizin (10 or 20 µg/ml) for 6 h. Percentage (%) of inhibition = [100-{cytokines production by L. major DNA with glycyrrhizin/cytokines production by L. major DNA alone}]×100. The data represent three independent experiments: one representative for C and the mean and SEM in A, B, D (*p<0,05, **p<0,01).

