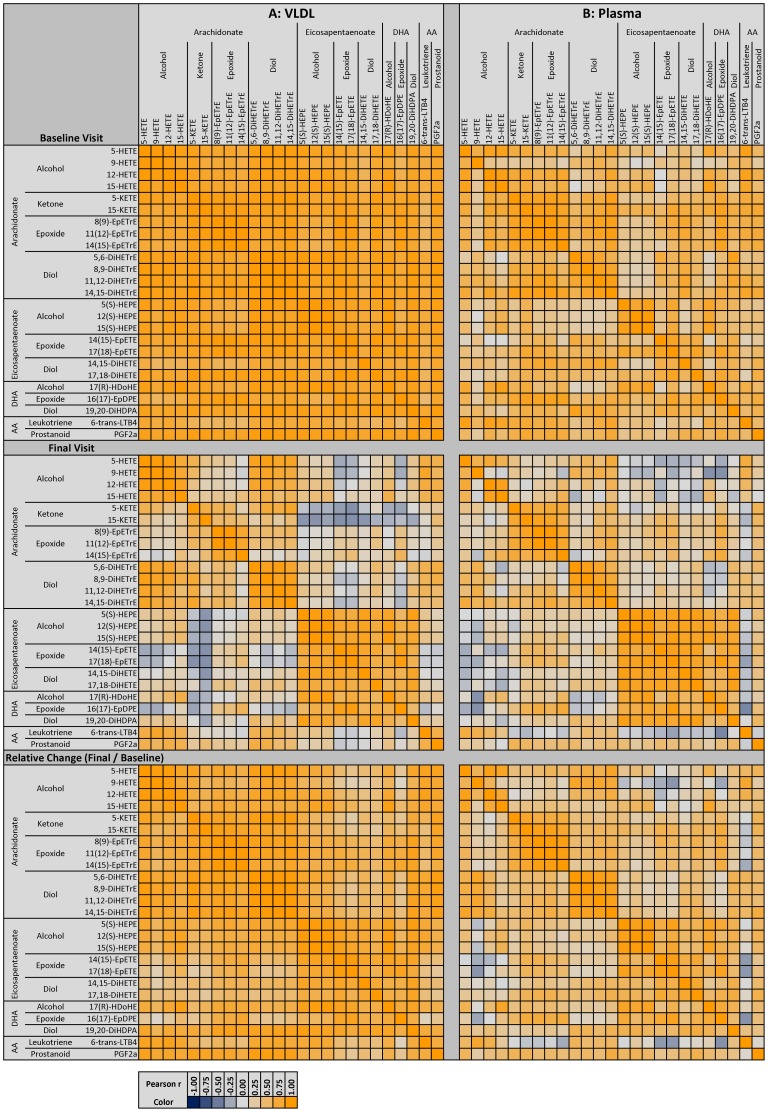
Figure 5. Correlation Heat Map for VLDL and whole plasma-oxylipins.
The Pearson correlation coefficient (r) among lipoprotein-oxylipins for VLDL (A) and whole plasma oxylipins (B) is shown before treatment (top), after treatment (middle) as correlation of nM oxylipin/mM PL along with the change in oxylipins due to treatment (bottom) expressed as ln(nM oxylipinfinal/mM PLfinal)/ln(nM oxylipinbaseline/mM PLbaseline).

