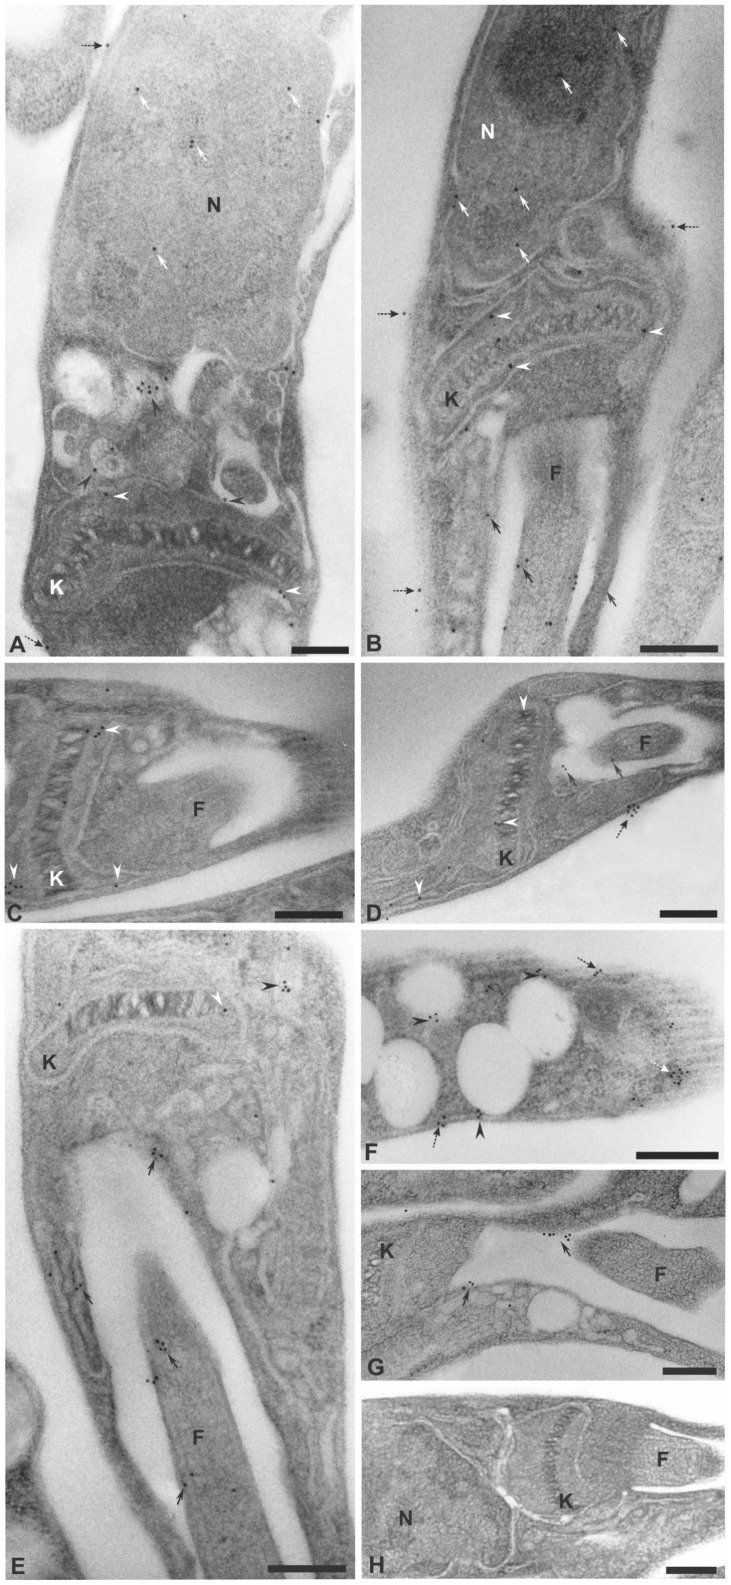
Figure 7. Sub-cellular localization of ENTPDases in L. infantum chagasi promastigotes.
Electron micrographs using polyclonal antibodies to rLicNTPDase-2 anti-IgG conjugated to 10 nm colloidal gold (A–H). Letters and symbols indicate different localizations: nucleus (N) (white arrow), mitochondria and kinetoplasts (K) (white arrowhead), internal vesicles (black arrowhead), flagellum (F) and flagellar pocket (black arrow) and cell surface (dashed black arrow). No staining was observed in the control (H). Bars: A, C, F, G = 0.1 µm and B = 0.3 µm, C, D and E, H 0.2 µm.

