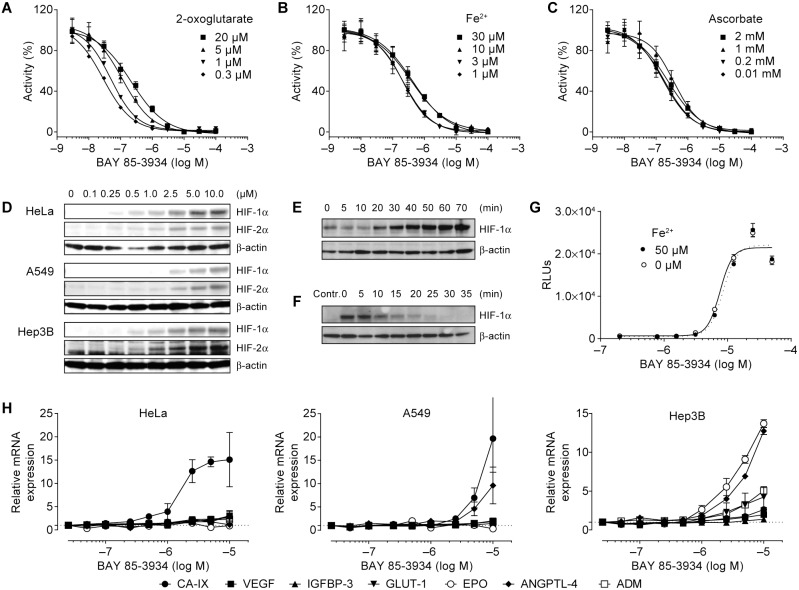
Figure 1. Characterization of the in vitro activity of BAY 85-3934.
(A)–(C) Concentration–response curves of hypoxia-inducible factor prolyl hydroxylase (PHD2) activity for BAY 85–-934 after the addition of increasing concentrations of 2-oxoglutarate, Fe2+, and ascorbate. Data, presented as means ± SEM of 4 replicates, were normalized to basal activity without BAY 85-3934 (100%) and residual activity (0%). (D) Detection of HIF-1α and HIF-2α in HeLa, A549, and Hep3B cells by western blot analysis. (E) Time-course of induction of HIF-1α in HeLa cells after addition of serum-free medium containing BAY 85-3934 (5 µM). β-actin levels were measured as a loading control. (F) Time-course of disappearance of HIF-1α in A549 cells after induction with BAY 85-3934 (20 µM). Culture medium was withdrawn and replaced with medium containing cycloheximide (100 µM). β-actin levels were measured as a loading control (D–F show representative data of 3 independent experiments). (G) Concentration–response curve for luciferase activity of A549 HIF-RE2 reporter cells (relative luciferase units [RLUs]) after addition of BAY 85-3934 in the presence or absence of additional Fe2+. Data are presented as means ± SEM of 4 replicates. (H) Relative mRNA expression levels (means ± SD of 2 replicates) of a panel of HIF target genes (shown as fold-increase from baseline levels) after exposure to BAY 85-3934 in HeLa, A549, and Hep3B cells. For definition of gene symbols, see Table 1.

