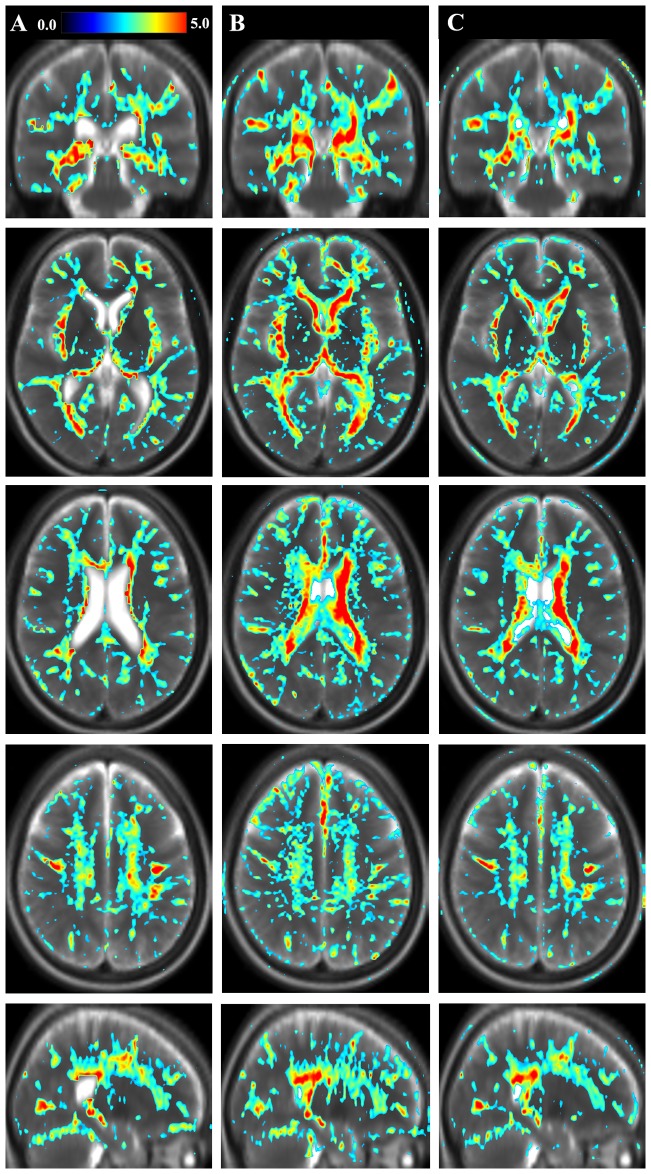
Figure 2. Geometrical representation of tissue parameter differences between groups.
The figure shows differences in tissue parameters between the group of Multiple Sclerosis (MS) patients and the reference group. Shown as the color overlay is the T-statistics of the voxel-based differences between groups. A) longitudinal relaxation rate (R ); B) transversal relaxation rate (R
 ); C) proton density (PD) in one coronal, three axial and one sagittal slice. The color scale represents T = 0.0–5.0. The figure shows uncorrected statistics, thresholded at T = 2. In the background a synthetic T2-weighted image of the same slice is displayed for visual guidance.

