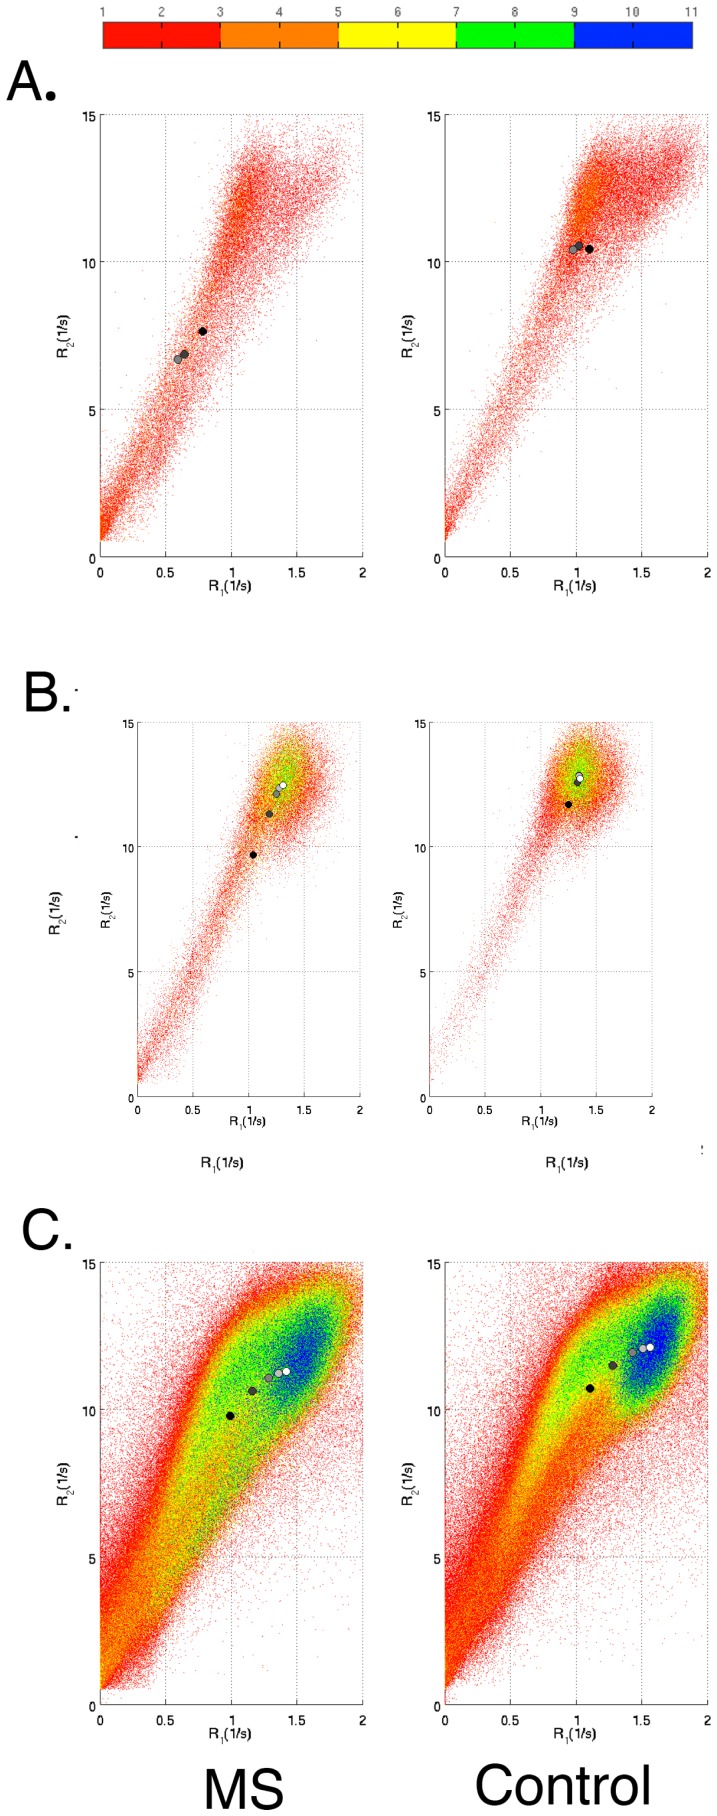
Figure 6. Effect of regions of interest (ROI) size on tissue parameters.
The figure shows R –R
–R plots in ROIs for the Multiple Sclerosis (MS) and the reference group, respectively. A) Caudate nucleus; B) Thalamus; C) Total white matter. The color bar shows within-ROI distance from the ROI surface. The circles show mean R
 and R
and R values in 0, 2, 4, 6, and 8 mm reduced ROIs. Black circles represent 0 mm reduction and white circles represent 8 mm reduction.

