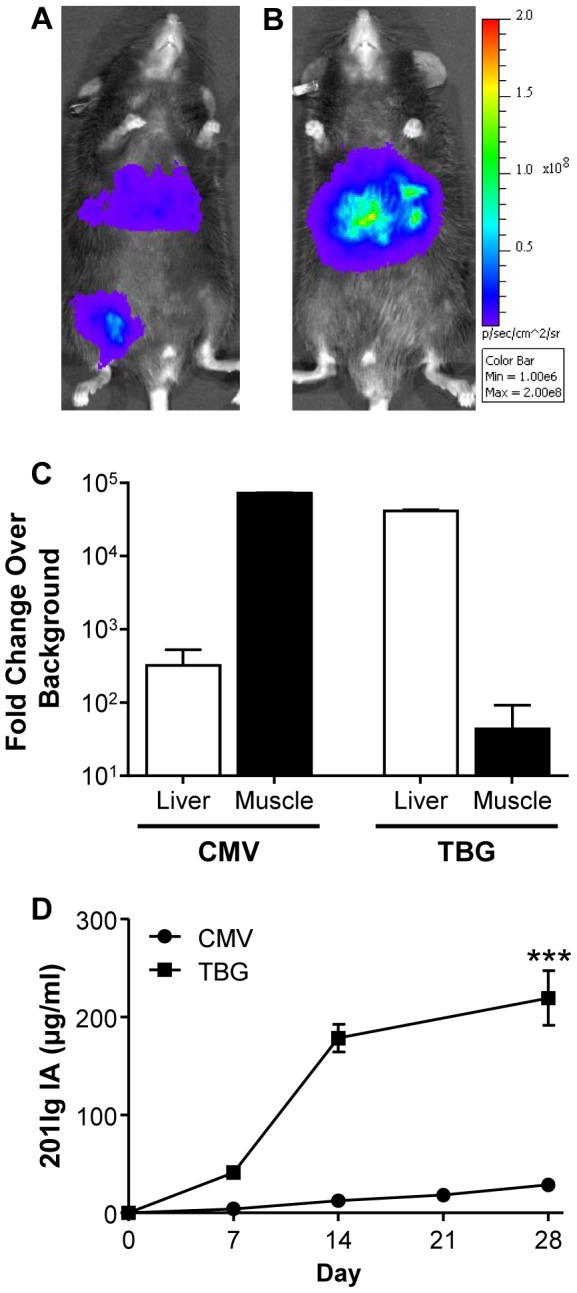
Figure 1. Liver expression following IM vector administration in mice.

Visualization of differential ffLuc expression patterns using Xenogen whole-body bioluminescent imaging on day 7 post-IM administration of 1010 GC AAV8.CMV.ffLuc (A) or AAV8.TBG.ffLuc (B) to C57BL/6 mice. Vector was administered as one 10 µl injection into the gastrocnemius muscle of the right leg. (C) ffLuc expression was quantified at day 28 post-vector administration by ffLuc tissue assays. ffLuc expression measured as RLU normalized to the total protein concentration of the organ. Data are presented as fold change over background where background was RLU/total protein of organ (g) in control tissues from un-injected mice. (D) Comparison of expression of 201Ig IA from the CMV and TBG promoters following a 10 µl IM injection in RAG KO mice. Expression of 201Ig IA in serum was measured by ELISA. Values are expressed as mean ± SEM (n = 4/group). ***p<0.001.
