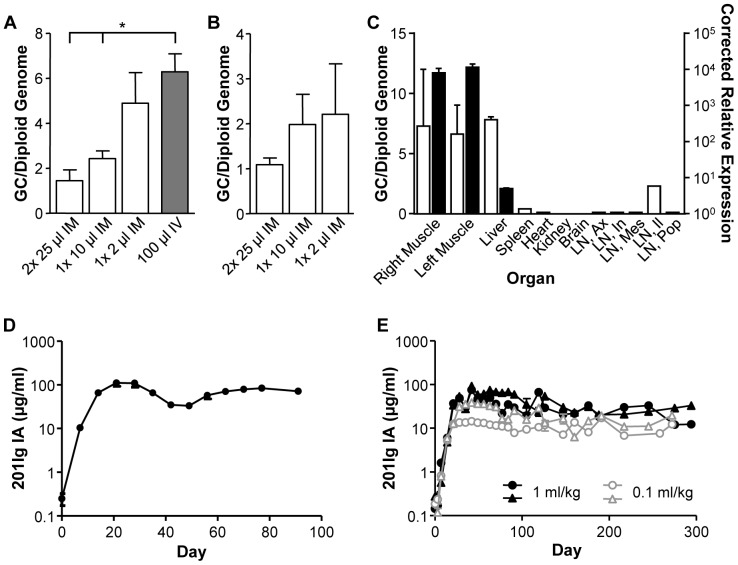
Figure 6. Translation of influence of injection volume to a large animal model, the rhesus macaque.
RAG KO mice were injected with 1010 GC AAV8.CMV.201Ig IA either by IM or IV injection; tissues were harvested on day 56 and analyzed for vector genome copies (GC), quantified as GC/diploid genome in (A) liver and (B) muscle. (C) Biodistribution of AAV8 vector was determined on day 90 post-vector administration in a rhesus macaque. Vector was administered at a dose of 3×10¹² GC/kg by IM injection into the vastus lateralis muscle of both right and left legs as 1 ml injections per kg body weight (vector concentration of 3×10¹² GC/ml). DNA and RNA were extracted for quantification of GC (open bars) and transcript levels of 201Ig IA (closed bars), respectively. Values for muscle are the average of measurements at 12 sites throughout the injected muscle and liver is the average of the four lobes, which were quantified separately. There was no detectable GC or RNA in control (un-injected) muscle samples. LN, lymph node; Ax, axillary; In, inguinal; Mes, mesenteric; Il, iliac; Pop, popliteal. (D) Time course of expression of 201Ig IA in serum. (E) Rhesus macaques were injected IM with 3×10¹¹ GC/kg of AAV8.CMV.201Ig IA, as either 1 ml vector injections per kg body weight (3×10¹¹ GC/ml) or 0.1 ml injection per kg body weight (3×10¹² GC/ml) (n = 2/group). Expression of 201Ig IA was measured in serum by ELISA and values are expressed as mean ± SEM. *p<0.05.

