Abstract
Background
Assays with specificity and cost effectiveness are needed for the measurement of HIV-1 burden to monitor disease progression or response to anti-retroviral therapy (ART) in HIV-1 subtype C infected patients.
Objectives
The objective of this study was to develop and validate an affordable; one step Real-Time RT-PCR assay with high specificity and sensitivity to measure plasma HIV-1 loads in HIV-1 subtype C infected patients.
Results
We developed an RT-PCR assay to detect and quantitate plasma HIV-1 levels in HIV-1 subtype C infected patients. An inverse correlation between plasma viral loads (PVL) and CD4+ T-cell numbers was detected at all CDC stages. Significant correlations were found between CD8+ T-cell activation and PVL, as well as with the clinical and immunological status of the patients.
Conclusions
The RT-PCR assay provides a sensitive method to measure PVL in HIV-1 subtype C infected patients. Viral loads correlated with immune activation and can be used to monitor HIV care in India.
Keywords: real-time RT-PCR, HIV-1 viral load, HIV-1 subtype C
1. Introduction
As per the UNAIDS/WHO 2005 report, more than 5 million people in India are living with HIV/AIDS. Anti-retroviral therapy (ART) is becoming more accessible to HIV-1 infected patients in India. Efficacy of ART is assessed by measuring plasma viral loads (PVL) and CD4+ T cell numbers. Progressive HIV infection is characterized by increased PVL, decreased CD4+ T-cell numbers, and immune activation (Mellors et al., 1997; O’Brien et al., 1997). However, assaying CD4+ T cell numbers alone is inadequate for HIV monitoring, since the normal T lymphocyte reference range of the study population has enormous variation due to age, sex, and other factors (Amatya et al., 2004; McCune, 2001). The PVL provide an accurate measure to identify new infections, monitor disease progression and response to ART (Clerici et al., 1997; Ho et al., 1995; Katzenstein and Holodniy, 1995; Wei et al., 1995). Chronic immune activation detected by the co-expression of CD38 and HLA-DR on CD4+ and CD8+ T-cells correlates with disease progression (Clerici et al., 1997; Swanson et al., 2005). These parameters have not been well defined in HIV-1 C infection. We have developed an RT-PCR based assay to quantitate HIV-1 subtype C viral RNA levels in patients from Northern India. The HIV-1 RNA levels quantified by this assay were correlated with CD4+ T-cell numbers and immune activation as measured by activated CD8+ T-cell subsets.
2. Materials and methods
2.1. Patients and sample collection
The patient cohort previously seen at the AIDS clinic, Department of Microbiology, All India Institutes of Medical Sciences (AIIMS), New Delhi, consisted of 133 ART-naïve patients and 42 patients receiving ART (Amatya et al., 2004; Vajpayee et al., 2007; Vajpayee et al., 2005). The ART consisted of Highly Active Anti-Retroviral Therapy (HAART) or dual therapy of nucleotide reverse transcriptase inhibitors and non- nucleotide reverse transcriptase inhibitors or protease inhibitors following WHO guidelines (Vajpayee et al., 2007). Healthy individuals seronegative for HIV-1 and 2, (n=25) served as normal controls. Five ml peripheral blood samples were obtained from all patients and control subjects. Plasma samples were used for viral load measurements. Flow cytometric and hematological analysis were performed to determine numbers and activation status of T cell subsets. The study was approved by the institutional Human Ethics Committee, AIIMS.
Peripheral blood mononuclear cells (PBMC) from two patients were co-cultured with uninfected PBMC in vitro and assayed for p24 antigen by an antigen capture ELISA (Perkin-Elmer Life Sciences, Inc., Boston, MA). These virus stocks were diluted with plasma from HIV-negative subjects to serve as positive controls.
2.2. Real-time PCR assay and primers and probe for HIV-1 RNA quantification
HIV-1 Subtype C primers and probe were designed using Primer Express Software and were located in the highly conserved gag gene, with a bias towards HIV subtype C. The primers, Gag 1235F (5′ CTAGAACTTTRAATGCATGGGTAAAAGTA 3′) and Gag 1349R (5′ GAT GTC CCC CCA CTG TAT TTA ACA 3′), amplified a 137 bp fragment. The Gag probe is a minor groove binder, non-fluorescent quencher probe, labeled with the fluorescent dye FAM (6-carboxy-fluorescein) at the 5′ end (6FAM - CAT TAT CAG AAG GAG CCA CC - MGBNFQ) (PE, Applied Biosystems). The primers were used to amplify a 137 bp region from the recombinant plasmid p96ZM651.8, (NIH AIDS Reference and Reagent repository) a nearly full-length molecular clone of the HIV-1C isolate from Zambia (Pollakis et al., 2003; Rodenburg et al., 2001). The PCR product was cloned into a linearized plasmid vector pCR® 3.1 (TA cloning kit, Invitrogen, Carlsbad, USA) downstream of the T7 RNA polymerase promoter and purified. HIV-1 gag RNA was generated using an in vitro transcription assay (Invitrogen), purified and quantitated. Serial dilutions of the transcripts were performed in water containing 30 μg/ml carrier t-RNA, reverse transcribed, and amplified by real time PCR. The standard curve generated based on these transcripts was used for extrapolating the quantity of RNA in plasma samples.
Viral RNA was extracted from 140 μl or 280 μl plasma samples and culture supernatants using the QIAamp viral RNA mini kit (Qiagen, Hilden, Germany) and eluted in 30 μl nuclease-free water. Real-time reverse transcription PCR was optimized with the one step RT-PCR master mix (PE, Applied Biosystems, Foster City, CA, USA) using two enzyme RT-PCR protocols. Each 25μl RT-PCR reaction mixture contained 12.5 μl of commercial optimized, one step RT-master mix (2X) containing AmpliTaq Gold DNA polymerase, dNTPs, a passive reference (6-carboxy-rhodamine; ROX), recombinant Moloney Murine Leukemia Virus (MuLV), RNase inhibitor mix, 250 nM of Gag probe, 600 nM each of Gag 1235F and Gag 1349R, nuclease-free water, and 10 μl diluted standard or template RNA. Thermal cycling conditions were 45 min at 48 °C, 10 min at 95 °C, followed by 40 cycles at 95 °C for 20 sec and 1 min at 60 °C. Reverse transcription, amplification, data acquisition, and analysis were performed using an ABI Prism 7700 Sequence Detector System. All standard dilutions were run in triplicate, patient samples were run in duplicate, and the average value of the threshold cycle CT was used to quantify RNA copies.
Internal control
High titer MS2 phage stocks (ATCC) were grown and processed as described for HIV-1 RNA. Serial-fold dilutions of MS2 RNA were reverse transcribed and amplified by one-tube real-time PCR. The use of MS2 phage as an internal control was validated by comparing the slopes obtained from plotting the CTs obtained with serial dilutions of HIV-1 in vitro transcripts and MS2 phage RNA against the concentrations. As an internal control, 106 MS2 phage particles were spiked into plasma samples. Specific amplification and detection of MS2 RNA was performed using 60 nM forward primer MS2F (5′-CGGCTGCTCGCGGATA-3′) and reverse primer MS2R (5′-TAGCGACCACTGTCGTGCTTT-3′). The MS2 Taqman probe (5′-CCTCGGGTTTCCGTCT-3′) is a MGB probe (Applied Biosystems).
2.3. Determination of specificity and sensitivity
The sensitivity and linearity of the assay was determined by performing a dilution series from 109 to 10−1 in triplicate of in vitro transcribed RNA. Serial dilutions of the culture supernatants and plasma samples were tested and the slopes were compared to ensure similar amplification efficiency of the system. We considered the assay verified if the difference in slopes was less than 0.1, which corresponded to less than 10% difference in efficiency. The PCR products from six HIV-positive samples were sequenced. Plasma samples from 25 HIV-1 negative blood donors were used as the negative controls to test the specificity of the assay. Viral RNA was extracted from 85 of 175 HIV-1 seropositive samples and quantified by the Amplicor HIV-1 Monitor Assay (version 1.5 or ultra-sensitive assay, Roche diagnostics, Meylan, France) using 200 to 500 μl plasma.
2.4. Quantification of CD4+ T-cells and activated CD8+ T-cells
Measurement of the CD4+ T-cell numbers and percentages of the activated CD8+ T-cells was performed by multicolor flowcytometry (Bectin Dickenson FACS Caliber) using a fluorochrome-conjugated antibodies specific for: CD45, CD14, CD3, CD4, CD8, CD38, and HLA-DR(BD Biosciences) (Vajpayee et al., 2005). Data was acquired by the CELLQUEST software and analyzed on FlowJo software. Total leukocyte counts were measured by an automated cell counter MS9 cell counter analyzer (Melet Schloesing Laboratories, Pontoise, France).
2.5. Statistical analysis
Correlation between the log10 transformed PVL values obtained by the two assays was determined by Spearman rank correlation (STATA 8.0 software). Bland and Altman analysis was used to assess the agreement between the viral loads measured by the two assays. Correlation between the CD4+ T-cells, CD8+ T-cells and log10 transformed PVLs was again determined by Spearman rank correlation.
3. Results
3.1. Development of a quantitative assay for plasma HIV-1 load measurements
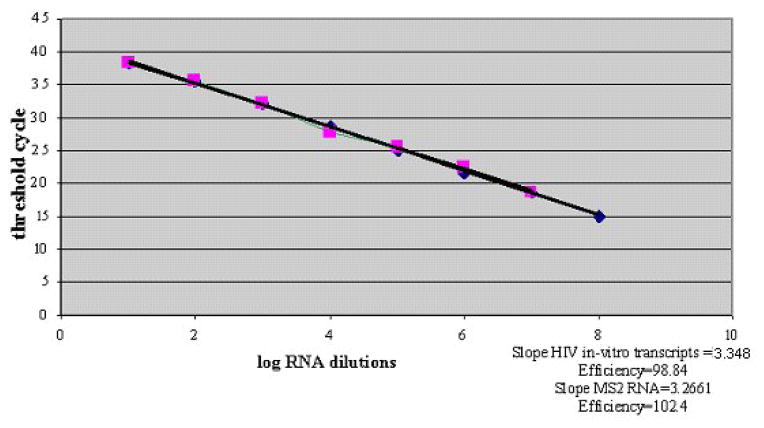
The real-time RT-PCR assay had a specificity of 100%, (none of the HIV-1 seronegative plasma samples amplified). Sequences of the six RT-PCR products were aligned with the HIV-1 subtype C consensus sequence and demonstrated 97% to 99% homology. Average CT values obtained with dilutions of RNA transcripts were plotted against the log-transformed values of the transcript serial dilutions (Figure 1). The upper limit of detection was 107 RNA copies/ml. The assay showed linearity over eight orders of magnitude from 10 to 108 with a high coefficient of correlation (r2 = 0.9994) and the slope calculated for the standard curve was −3.3884 (Figure 1). Intra-assay variation was assessed using virus dilutions from 102 to 106 copies in triplicates. The coefficient of variation for CT of all dilutions was <1.7% and for the standard dilutions and two plasma specimens were <4.2% and 2.8% respectively.
Fig.1.
Standard curve for quantification of HIV-1 plasma viral loads. Amplification efficiencies of HIV RNA standards and MS2 RNA are compared. Ten fold dilution series of the HIV-1 transcripts and MS2 RNA were plotted against threshold cycle. Each dot represents the average of triplicate measurements. Efficiency (E) = 10 1/s −1 (s = slope).
The efficiencies of serial dilutions of culture supernatants and plasma samples were calculated on a logarithmic scale. The efficiencies ranged between −3.3884 and −3.2885, verifying similar reaction efficiencies among RNA transcripts, culture supernatants, and plasma virus. MS2 phage was verified as an internal control by comparing the slopes of HIV-1 RNA amplification and MS2 RNA (Fig. 1). The slope and the amplification efficiencies of the MS2 primers with MS2 probe were calculated as 3.2661 and 102.4%, respectively. The difference in the HIV-1 RNA and MS2 RNA amplification slopes was < 0.1, representing less than 10% difference in efficiency.
3.2. Validation of plasma viral load quantification by real-time RT-PCR
Plasma samples from 85 HIV sero-positive individuals were evaluated for viral loads by both real-time RT-PCR assay and the Amplicor HIV monitor assay. The limit of detection for real-time RT-PCR was 107 copies/ml whereas the Amplicor assay had a 50 copies/ml limit of detection.
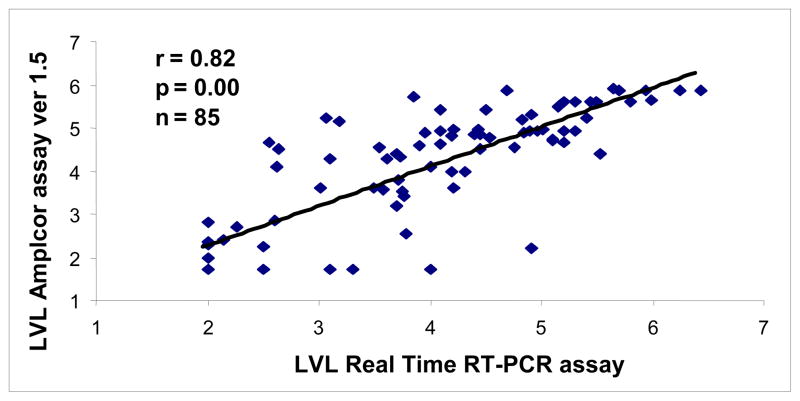
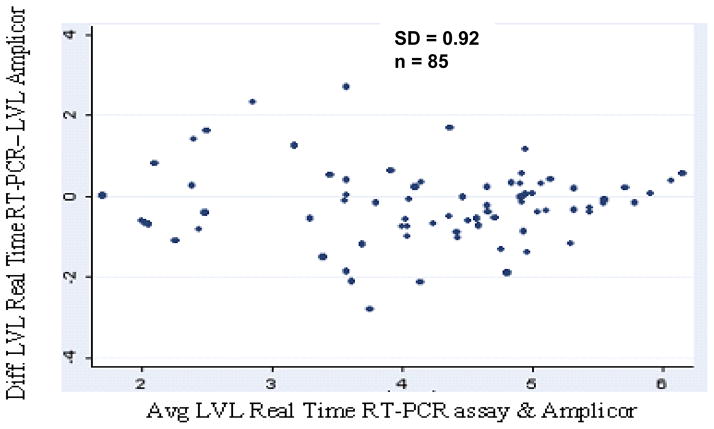
The HIV RNA copies/ml in plasma samples quantified with the real-time PCR assay ranged from 138 to 2,700,000 copies/ml, and with Amplicor assay, measured RNA copies/ml ranged between 169 and 750000. Real-time RT-PCR data revealed a mean viral load of 3.92 log10 compared to 4.05 log10 for the Amplicor data and showed similar trends when compared among the CDC classes A, B, and C (Table 1). Quantitative analysis of the viral loads by both methods demonstrated a high correlation (r = 0.82, p < 0.00001) in 85 samples (Figure 2), and in 13 of 85 patients on antiretroviral therapy (r = 0.93, p < 0.00001). Viral load measurements for 75% of the samples were within 0.5 log10. Differences less than 1 log10 were observed for 92% of the samples. There was a mean difference of 0.13 log 10 (95% confidence interval 0.05 to 0.31; p = 0.16) observed for PVLs obtained by both assays. There was no discordance between both assays (p = 0.159) even at the higher or lower viral RNA levels (Figure. 3).
Table 1.
Correlation between logarithmic viral load values detected by the real-time assay and Amplicor ver 1.5 for 85 HIV-1 seropositive study subjects in various CDC classes, of whom 72 were therapy naïve and 13 were receiving antireteroviral therapy.
| ART naïve HIV infected individuals (n = 72) | Mean LVL ± S.D. (Real-time) | Mean LVL ± S.D. (Amplicor assay) | Correlation coefficient (p value) |
|---|---|---|---|
| CDC class A (n = 32) | 3.7 ± 1.14 | 3.95 ± 1.25 | 0.80 (0.0080) |
| CDC class B (n = 32) | 4.2 ± 1.29 | 4.33 ± 1.39 | 0.74 (0.0000) |
| CDC class C (n = 8) | 4.8 ± 0.97 | 4.60 ± 1.40 | 0.82 (0.0007) |
| HIV infected individuals on ART (n = 13) | 3.1 ± 1.13 | 3.30 ± 1.50 | 0.93 (0.0000) |
Fig.2.
Correlation between logarithmic plasma HIV-1 RNA copies/ml detected by real-time RT-PCR and Amplicor ver 1.5 (r = 0.82). HIV-1 seropositive plasma samples (n=85) with a wide range of HIV-1 viral loads were measured. LVL is log 10 viral loads.
Fig.3.
Agreement of HIV-1 log10 RNA load measurement between real-time RT-PCR and Amplicor ver1.5 as described by Bland and Altman.
Ten of 85 patient samples had undetectable HIV RNA levels by both assays. Seven patient samples had undetectable viral loads by at least one assay. Four samples had detectable viral loads only by the real-time PCR assay and three samples had detectable viral loads by Amplicor assay.
3.3. Plasma viral loads in HIV-1 infected patients by real-time RT-PCR
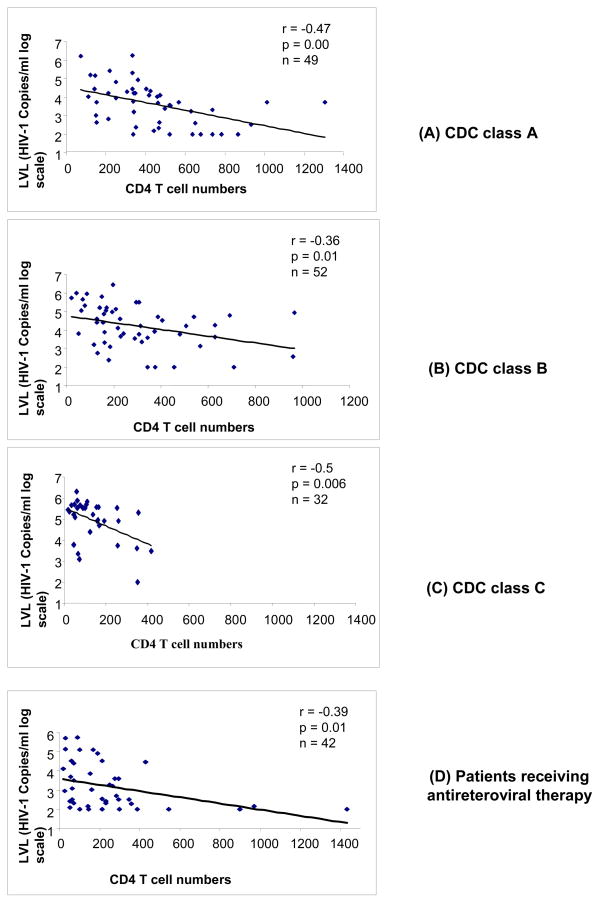
The HIV-1 RNA loads were measured by real-time RT-PCR in plasma samples from 175 HIV-1 infected patients (Kamat et al., 2007). A significant negative correlation (r = −0.53, p = 0.00) was observed in 133 ART-naïve patients between PVL and CD4+ T-cell numbers (range: 18 to 1307 cells/mm3). The mean values for log viral RNA copies/ml plasma for patients in the CDC classes A (n = 49), B (n = 52), and C (n = 32) were 3.62 ± 1.14, 4.2 ± 1.12, and 4.92 ± 0.98, respectively (Table 2). Increased viral loads in the patient groups correlated with loss of CD4+ T-cell numbers and poor clinical status. There was statistically significant negative correlation between log viral load and CD4+ T-cell numbers in HIV infected patients in CDC groups A (r = −0.47; p = 0.0000), B (r = −0.36; p = 0.01), and C (r = −0.5; p = 0.006) (Figure 4A, 4B, and 4C).
Table 2.
Mean logarithmic viral loads detected by the real-time assay and mean values of CD4+ T cell numbers for 175 HIV-1 seropositive study subjects in various CDC classes, of whom 133 were therapy naïve and 42 were receiving antireteroviral therapy.
| ART naïve HIV infected individuals (n = 132) | Mean LVL ± S.D. (Real-time) | Mean CD4+ T cell numbers/μL |
|---|---|---|
| CDC class A (n = 49) | 3.62 ± 1.14 | 440 ± 255 |
| CDC class B (n = 52) | 4.20 ± 1.12 | 297 ± 220 |
| CDC class C (n = 32) | 4.92 ± 0.98 | 143 ± 109 |
| HIV infected individuals on ART (n = 42) | 3.20 ± 1.17 | 246 ± 277 |
Fig.4.
Association of plasma viremia (log10 viral load) with loss of CD4+ T-cell numbers in therapy-naïve study subjects stratified according to CDC classes A, B, and C (Figure 4 A, B, and C) and (D) in study subjects on anti-retroviral therapy. Pearson correlation coefficients and p value are shown in the figure.
We detected PVL (range: 120 to 550000; mean log of 3.2 ± 1.17 HIV RNA copies/ml) in 34 out of 42 patients receiving ART at the time of sampling. There was a negative correlation between CD4 T-cell numbers and PVL in patients receiving ART (r = −0.39; p = 0.01) (Figure 4D). The mean log PVL in patients receiving ART for more than 6 months (n = 22) was 3.81 ± 1.2, with a maximum log viral load of 5.74. The mean log values of PVL in individuals receiving ART for less than 6 months (n = 20) was 2.33 ± 0.66, with a maximum log viral load of 3.7. The difference in PVLs was statistically significant (p = 0.0000) (Data not shown). The individuals receiving ART for > 6 months had higher mean PVLs than individuals receiving ART for < 6 months.
3.4. Correlation between plasma viremia and the presence of activated CD8+ T cells
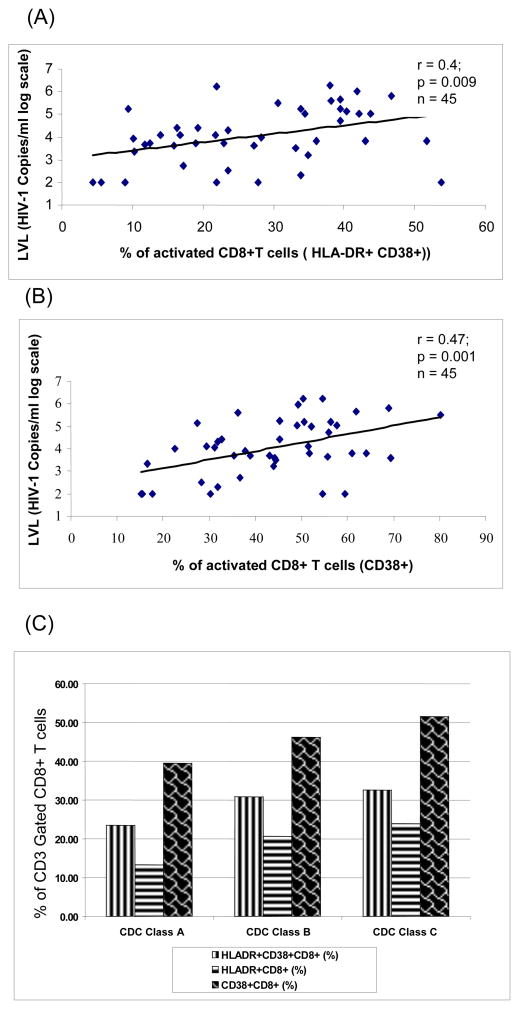
We studied the correlation between percentage of activated CD8+ T-cells (CD38+, HLA-DR+) and plasma HIV-RNA levels in 45 out of 133 ART-naïve HIV-1 infected individuals. Significant positive correlation (r = 0.4, p = 0.009 and r = 0.47, p = 0.001) was observed between the level of activated CD8+ T-cell subsets (CD8+HLA-DR+CD38+ and CD8+CD38+, respectively) and log10 transformed plasma HIV RNA levels as measured by the real-time PCR assay (Fig 5A and B). This positive correlation is reflective of the CD8+ T-cell response to the presence of HIV antigen. As reported previously, progression was associated with a decrease in CD4+ T-cells as well as CD8+ T-cells. We found that despite a decrease in CD8+ T-cell numbers, there was a higher percentage of CD8+ T-cell activation associated with progression from CDC class A to CDC Class C (Figure 5C).
Fig.5.
Association of plasma viremia (log10 viral load) with immune activation as measured by the expression of activation markers HLA-DR (5A) and CD38 (5B) on CD8+ T cells. Pearson correlation coefficients and p value are shown. (C) Inverse correlation between CDC staging and immune activation in CD8+ T cells.
4. Discussion
We have developed a simple, sensitive and cost-effective assay for the measurement of HIV-1 loads in HIV-infected patients in India. The RT-PCR assay measures product accumulation in real time, providing better quantification of initial copy number within a dynamic range of detection. The use of a minor groove binder probe contributes to the accurate measurement of the reporter dye and allows use of shorter probes with better specificity and sensitivity. Since a single mismatch can lead to reduced amplification efficiency, resulting in decreased viral load measurements (Kutyavin et al., 2000; Whiley and Sloots, 2006), the forward primer was designed with a single degenerate nucleotide. Our assay was highly specific, as none of the HIV-1 negative healthy donor samples showed any positive fluorescent signal. The standard curve showed linearity over eight orders of magnitude with a high coefficient of correlation, indicating high sensitivity in determining viral loads over a broad range (Fig. 1). Data obtained by real-time PCR and Amplicor ver 1.5 assays for PVL were comparable, demonstrating high correlation between the two assays thus, validating our RT-PCR assay (Figs. 2 and 3) and is in agreement with previous report (Kamat et al., 2007). The minor differences observed may be due to minor mismatches in the primer or the probe in individual samples or may be attributed to the difference in efficiency of the RNA extraction protocols used in both methods. The median values of PVL as measured by real-time and Amplicor assays within the CDC classes A, B, and C in therapy-naïve patients and patients on therapy showed a similar trend (Table 1).
HIV infection is characterized by a progressive CD4 T-cell loss with an increase in plasma HIV-RNA loads. Cross-sectional analysis of HIV-1 infected individuals showed a direct relationship between the magnitude of CD4+ T cell depletion, extent of immune deficiency and viral load as measure by real-time PCR (Table 2 and Fig 4). An increase in expression of immunologic markers CD38 and HLA-DR on CD8+ T-cells is associated with high levels of viremia in the absence of ART, thus, complementing the prognostic value of CD4+ T-cell numbers and PVLs. The activated CD8+ T-cell subsets, CD8+HLA-DR+CD38+ and CD8+CD38+, correlated positively with log10 transformed plasma HIV RNA levels (Fig. 5A, B, C and D). The highly significant correlation between viral replication and T-cell activation is in agreement with previous reports (Benito et al., 2004). Furthermore, the decrease in CD8+ T cells in progressive HIV-1 infection can be indicative of impaired T cell homeostasis as has been previously described (Chattopadhyay et al., 2006). Impaired thymic functions and proliferative failure may also contribute to the loss of CD8+ T cells in advanced HIV infection. Loss of CD8+ T cell numbers in HIV infected patients in our study may also be reflective of the advanced stage of HIV infection. Majority of the HIV infected patients in India seeking clinical care may already have an advanced HIV infection. Patients receiving therapy for more than 6 months had significantly higher mean PVL than individuals who received ART for less than 6 months. Thus, the kinetics of viral decline during initial weeks of therapy corresponds to an exponential decay process. Higher viral loads in patients receiving antiretroviral therapy for more than 6 months could be explained by either emergence of drug resistant viral mutants or a greater degree of non-adherence or the presence of secondary infections(Solomon et al., 2006; Vajpayee et al., 2007).
In summary, we have developed a sensitive and specific assay with a wide dynamic range to quantify plasma viral RNA copies by real-time RT-PCR in Indian patients infected with HIV-1 Subtype C. Determination of correlations between viral replication, CD4+ T-cell depletion, and activated CD8+ T-cell allows for better understanding of the association between plasma viral loads and immunological markers at various clinical stages of disease. This assay can be reliably used for HIV disease monitoring and monitoring efficacy of antiviral therapies in many parts of the world with endemic HIV clade C infections.
Acknowledgments
We thank Christian Leuteneggar advice and technical support, Thomas Ndolo for manuscript review and Arindam Maitra for comments, the All India Institute of Medical Sciences for the support of the doctoral training of Atima Agarwal and Haynes Sheppard for the support of the Amplicor viral assays. This study was supported in part by the Northern California Center for AIDS Research and National Institutes of Health grant DK61297.
Footnotes
Publisher's Disclaimer: This is a PDF file of an unedited manuscript that has been accepted for publication. As a service to our customers we are providing this early version of the manuscript. The manuscript will undergo copyediting, typesetting, and review of the resulting proof before it is published in its final citable form. Please note that during the production process errors may be discovered which could affect the content, and all legal disclaimers that apply to the journal pertain.
References
- Amatya R, Vajpayee M, Kaushik S, Kanswal S, Pandey RM, Seth P. Lymphocyte immunophenotype reference ranges in healthy Indian adults: implications for management of HIV/AIDS in India. Clin Immunol. 2004;112:290–5. doi: 10.1016/j.clim.2004.04.008. [DOI] [PubMed] [Google Scholar]
- Benito JM, Lopez M, Lozano S, Martinez P, Gonzalez-Lahoz J, Soriano V. CD38 expression on CD8 T lymphocytes as a marker of residual virus replication in chronically HIV-infected patients receiving antiretroviral therapy. AIDS Res Hum Retroviruses. 2004;20:227–33. doi: 10.1089/088922204773004950. [DOI] [PubMed] [Google Scholar]
- Chattopadhyay PK, Douek DC, Gange SJ, Chadwick KR, Hellerstein M, Margolick JB. Longitudinal assessment of de novo T cell production in relation to HIV-associated T cell homeostasis failure. AIDS Res Hum Retroviruses. 2006;22:501–7. doi: 10.1089/aid.2006.22.501. [DOI] [PMC free article] [PubMed] [Google Scholar]
- Clerici M, Sarin A, Henkart PA, Shearer GM. Apoptotic cell death and cytokine dysregulation in human immunodeficiency virus infection: pivotal factors in disease progression. Cell Death Differ. 1997;4:699–706. doi: 10.1038/sj.cdd.4400314. [DOI] [PubMed] [Google Scholar]
- Ho DD, Neumann AU, Perelson AS, Chen W, Leonard JM, Markowitz M. Rapid turnover of plasma virions and CD4 lymphocytes in HIV-1 infection. Nature. 1995;373:123–6. doi: 10.1038/373123a0. [DOI] [PubMed] [Google Scholar]
- Kamat A, Ravi V, Desai A, Satishchandra P, Satish KS, Borodowsky I, Subbakrishna DK, Kumar M. Quantitation of HIV-1 RNA levels in plasma and CSF of asymptomatic HIV-1 infected patients from South India using a TaqMan real time PCR assay. J Clin Virol. 2007;39:9–15. doi: 10.1016/j.jcv.2006.12.026. [DOI] [PubMed] [Google Scholar]
- Katzenstein DA, Holodniy M. HIV viral load quantification, HIV resistance, and antiretroviral therapy. AIDS Clin Rev. 1995:277–303. [PubMed] [Google Scholar]
- Kutyavin IV, Afonina IA, Mills A, Gorn VV, Lukhtanov EA, Belousov ES, Singer MJ, Walburger DK, Lokhov SG, Gall AA, Dempcy R, Reed MW, Meyer RB, Hedgpeth J. 3′-minor groove binder-DNA probes increase sequence specificity at PCR extension temperatures. Nucleic Acids Res. 2000;28:655–61. doi: 10.1093/nar/28.2.655. [DOI] [PMC free article] [PubMed] [Google Scholar]
- McCune JM. The dynamics of CD4+ T-cell depletion in HIV disease. Nature. 2001;410:974–9. doi: 10.1038/35073648. [DOI] [PubMed] [Google Scholar]
- Mellors JW, Munoz A, Giorgi JV, Margolick JB, Tassoni CJ, Gupta P, Kingsley LA, Todd JA, Saah AJ, Detels R, Phair JP, Rinaldo CR., Jr Plasma viral load and CD4+ lymphocytes as prognostic markers of HIV-1 infection. Ann Intern Med. 1997;126:946–54. doi: 10.7326/0003-4819-126-12-199706150-00003. [DOI] [PubMed] [Google Scholar]
- O’Brien WA, Hartigan PM, Daar ES, Simberkoff MS, Hamilton JD. Changes in plasma HIV RNA levels and CD4+ lymphocyte counts predict both response to antiretroviral therapy and therapeutic failure. VA Cooperative Study Group on AIDS. Ann Intern Med. 1997;126:939–45. doi: 10.7326/0003-4819-126-12-199706150-00002. [DOI] [PubMed] [Google Scholar]
- Pollakis G, Abebe A, Kliphuis A, De Wit TF, Fisseha B, Tegbaru B, Tesfaye G, Negassa H, Mengistu Y, Fontanet AL, Cornelissen M, Goudsmit J. Recombination of HIV type 1C (C′/C″) in Ethiopia: possible link of EthHIV-1C′ to subtype C sequences from the high-prevalence epidemics in India and Southern Africa. AIDS Res Hum Retroviruses. 2003;19:999–1008. doi: 10.1089/088922203322588350. [DOI] [PubMed] [Google Scholar]
- Rodenburg CM, Li Y, Trask SA, Chen Y, Decker J, Robertson DL, Kalish ML, Shaw GM, Allen S, Hahn BH, Gao F. Near full-length clones and reference sequences for subtype C isolates of HIV type 1 from three different continents. AIDS Res Hum Retroviruses. 2001;17:161–8. doi: 10.1089/08892220150217247. [DOI] [PubMed] [Google Scholar]
- Solomon SS, Kumarasamy N, Celentano DD, Yepthomi TH, Arvind VP, Solomon S. Trends in HIV-related morbidity among patients admitted to a South Indian tertiary hospital between 1997 and 2003. AIDS Care. 2006;18:366–70. doi: 10.1080/09540120500201755. [DOI] [PubMed] [Google Scholar]
- Swanson P, de Mendoza C, Joshi Y, Golden A, Hodinka RL, Soriano V, Devare SG, Hackett J., Jr Impact of human immunodeficiency virus type 1 (HIV-1) genetic diversity on performance of four commercial viral load assays: LCx HIV RNA Quantitative, AMPLICOR HIV-1 MONITOR v1.5, VERSANT HIV-1 RNA 3.0, and NucliSens HIV-1 QT. J Clin Microbiol. 2005;43:3860–8. doi: 10.1128/JCM.43.8.3860-3868.2005. [DOI] [PMC free article] [PubMed] [Google Scholar]
- Vajpayee M, Kaushik S, Mojumdar K, Sreenivas V. Antiretroviral treatment in resource-poor settings: A view from India. Indian J Med Sci. 2007;61:390–7. [PubMed] [Google Scholar]
- Vajpayee M, Kaushik S, Sreenivas V, Wig N, Seth P. CDC staging based on absolute CD4 count and CD4 percentage in an HIV-1-infected Indian population: treatment implications. Clin Exp Immunol. 2005;141:485–90. doi: 10.1111/j.1365-2249.2005.02857.x. [DOI] [PMC free article] [PubMed] [Google Scholar]
- Wei X, Ghosh SK, Taylor ME, Johnson VA, Emini EA, Deutsch P, Lifson JD, Bonhoeffer S, Nowak MA, Hahn BH, et al. Viral dynamics in human immunodeficiency virus type 1 infection. Nature. 1995;373:117–22. doi: 10.1038/373117a0. [DOI] [PubMed] [Google Scholar]
- Whiley DM, Sloots TP. Sequence variation can affect the performance of minor groove binder TaqMan probes in viral diagnostic assays. J Clin Virol. 2006;35:81–3. doi: 10.1016/j.jcv.2005.05.002. [DOI] [PubMed] [Google Scholar]


