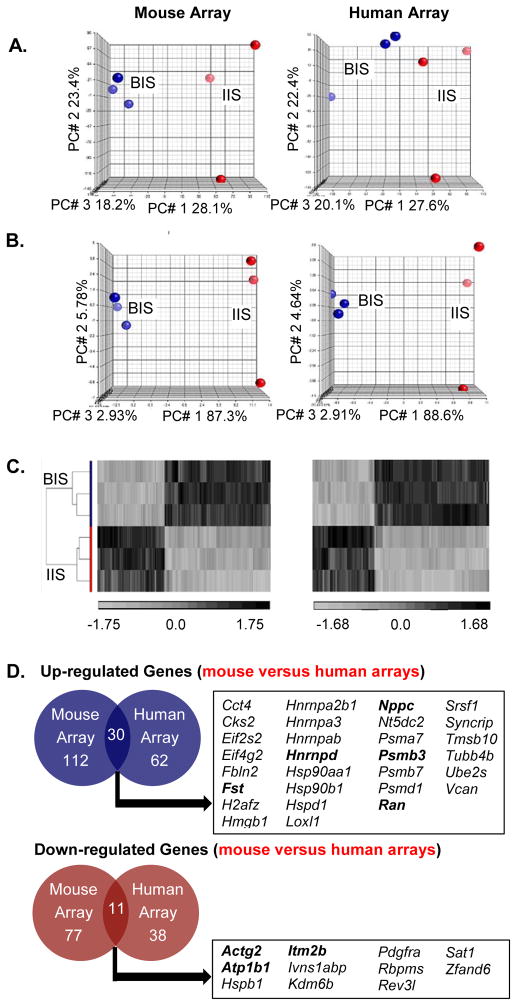
Figure 1. Transcriptome of the hamster uterine blastocyst implantation site (BIS) is distinct from interimplantation site (IIS).
A. Principal Component Analysis (PCA) on the entire probe sets using mouse and human microarray platforms showed two distinct transcriptomes with clear separation of BIS samples (red) from IIS samples (blue). The effect of blastocyst implantation is visible in all three repeats. B. PCA of differentiated genes [at least 1.5-fold (p<0.05)] demonstrated a clearer separation of the BIS (red) from the IIS (blue). C. Hierarchical clustering (heatmap) showed complete separation of differentially expressed 227 (mouse array: left panel) and 123 (human array: right panel) probes (at least 1.5-fold, p value < 0.05) between the BIS and IIS. Values shown are log base 2, and black, light grey, and medium gray indicate the highest, lowest, and median normalized signal values, respectively. Vertical dendrograms represent the three individual samples of hamster BIS and IIS. D. Venn diagrams illustrate the overlap of gene transcripts that were at least 1.5-fold (p<0.05) different between hamster embryo implantation and interimplantation sites in both human and mouse Affymetrix cDNA microarrays. Official symbols of the shared genes are presented in the box and bolded gene transcripts represent those whose mRNA levels were validated using real-time RT-PCR analysis.

