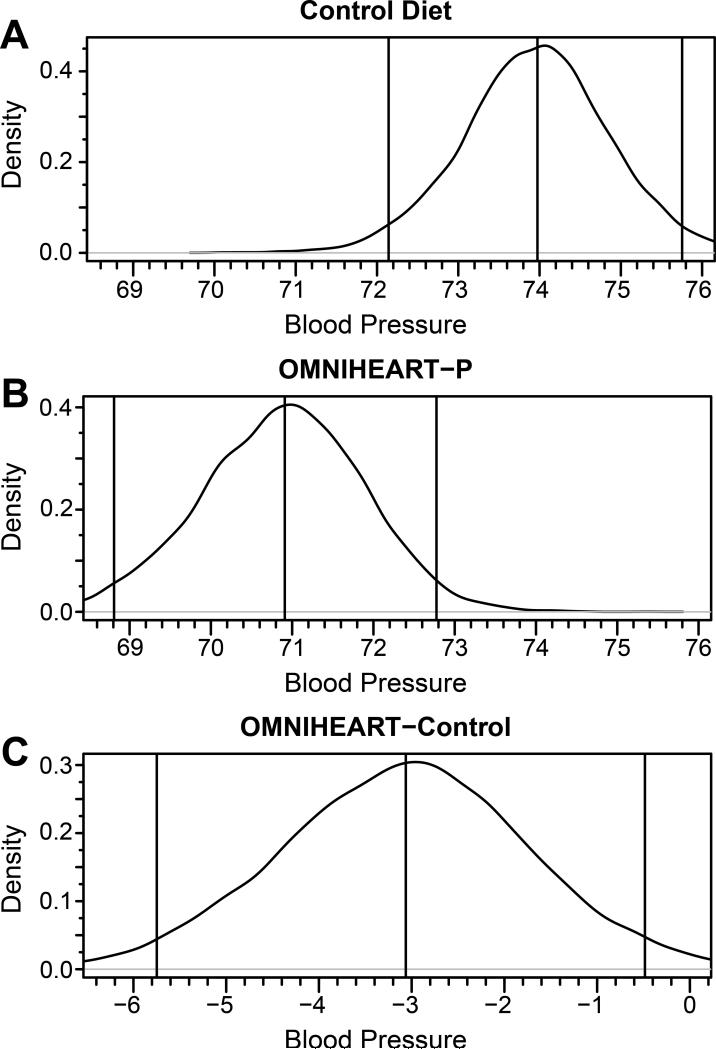
Figure 1.
Unadjusted posterior systolic blood pressure distribution obtained from Bayesian profile regression for Control nutrient profiles (A), OMNIHEART-P (protein arm) (B), and from OMNIHEARTP minus Control (C), US INTERMAP participants. Vertical lines represent (from left to right) lower bound of the 95% credible interval, mean, and upper bound of the 95% credible interval. The distribution from the Control nutrient profile (A) had a median of 119.2 (116.4, 121.8). The distribution from the OMNIHEART-P profile (B) had a median of 114.1 (111.3, 116.6). The distribution of the difference between the two profiles (C) had a median of −5.0 (−8.7, −1.5) and the probability that the difference was less than or equal to zero was approximately 1.

