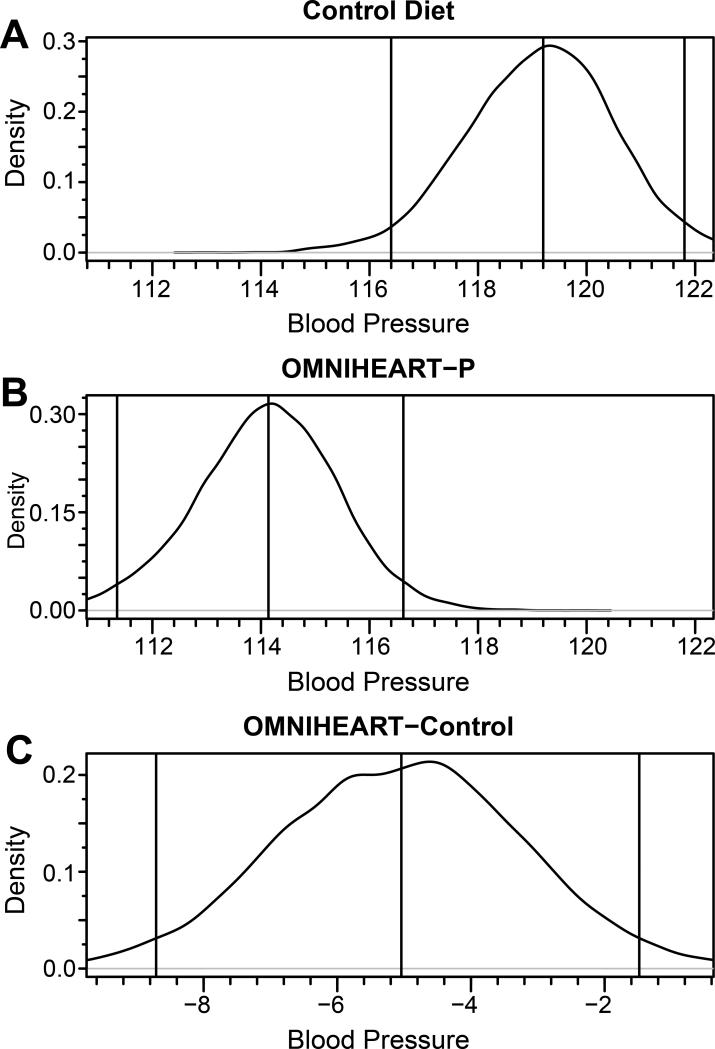
Figure 2.
Unadjusted posterior diastolic blood pressure distribution obtained from Bayesian profile regression for Control nutrient profiles (A), OMNIHEART (protein arm) (B), and from OMNIHEART (protein arm) minus Control (C), US INTERMAP participants. Vertical lines represent (from left to right) lower bound of the 95% credible interval, mean, and upper bound of the 95% credible interval. The distribution from the Control nutrient profile (A) had a median of 74.0 (72.1, 75.8). The distribution from the OMNIHEART-P profile (B) had a median of 70.9 (68.8, 72.8). The distribution of the difference between the two profiles (C) had a median of −3.1 (--5.7, −0.5) and the probability that the difference was less than or equal to zero was approximately 1.

