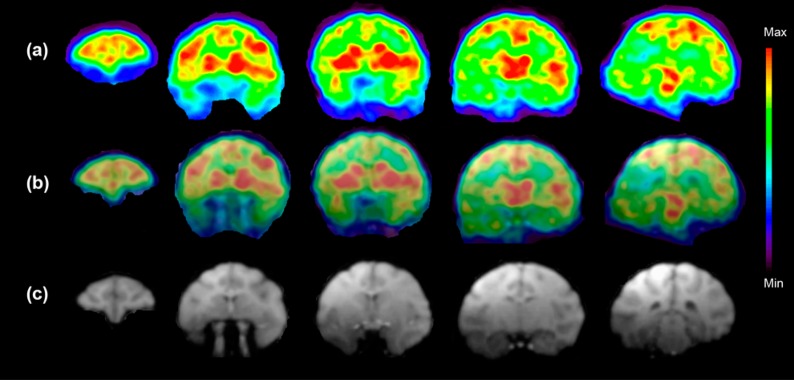
Figure 4.

(a) Color coded PET images show accumulation of [18F]3 in the selected five coronal slices of the monkey brain at the time point 5–15 min after the injection of radioactivity. These images show the highest accumulation of [18F]3 in the caudate, putamen, thalamus, and several cortical areas. (b) Fused PET and MR images from (a) and (c). (c) T1-weighted coronal MR images show the anatomical structures of selected brain areas. (n = 1) 189 MBq [18F]3 (37 ng/kg) was injected.
