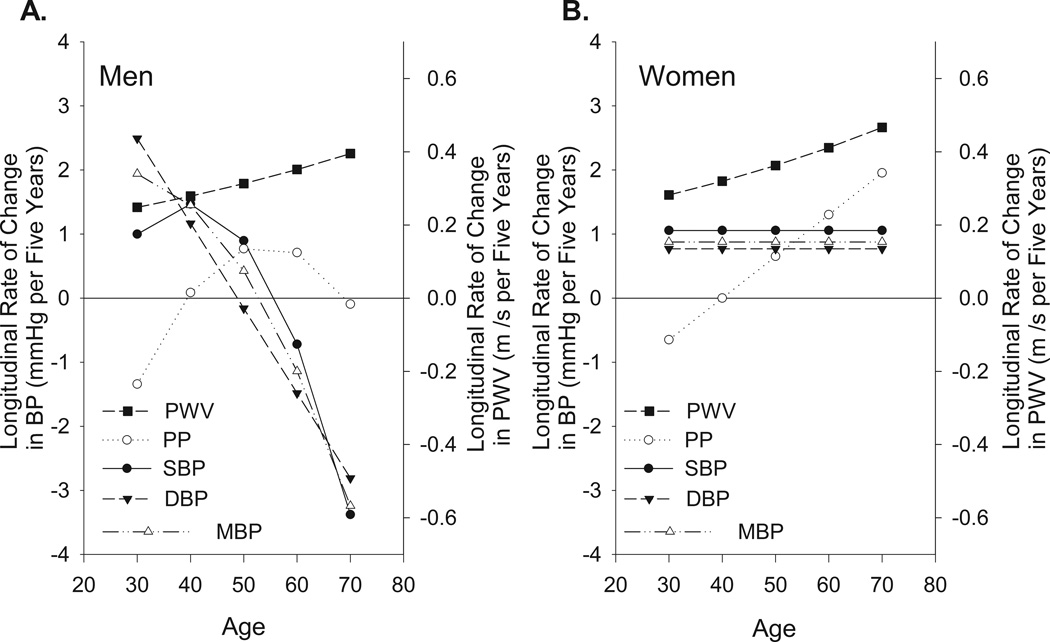
Figure 4.
Combined data from Figures 1C and 3 to compare five year longitudinal rates of change in PWV, PP, SBP, DBP, and MBP from mixed-effects models in men (panel A) and women (panel B) of different ages at entry into the study. Note, the general dissociation between the rate at which the BPs and PWV change in men.

