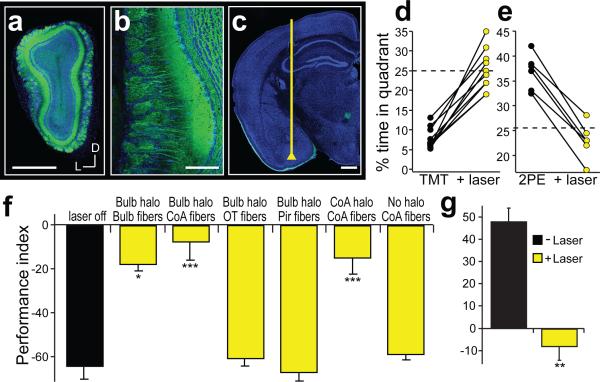
Figure 2. The projections from the olfactory bulb to cortical amygdala are required for innate aversion and attraction to odors.
a, Coronal section of a mouse olfactory bulb injected with AAV5-eNpHR3.0-eYFP. b, Magnified view of an olfactory bulb showing eNpHR3.0-eYFP expression in mitral cells. c, Coronal section depicting the placement of an optical fiber in cortical amygdala, above the axonal output from the olfactory bulb. Scale bar indicates 500 μm (a,c) and 100 μm (b). d,e, Mice were optically coupled to a yellow laser and tested in the behavioral assay for the response to TMT (d) or 2-phenylethanol (2PE) (e) with and without laser stimulation. The percent time each animal spent in the odor quadrant in the absence or presence of photoactivation. f, The mean performance index for mice exposed to TMT. The black bar indicates the average response of all mice to TMT in the absence of photoactivation, and the yellow bars indicate responses to TMT with photoactivation for different experimental animals. Bulb halo and CoA halo describe mice with halorhodopsin expression in the olfactory bulb and cortical amygdala, respectively. Optical fibers were placed above the bulb (n=3), cortical amygdala (CoA, n=11), olfactory tubercle (OT, n=7) or in piriform cortex (Pir, n=8) as denoted below site of injection. The last two bars on the right side have either halorhodopsin in the neurons of cortical amygdala (n=5), or receive no viral injection (n=4), and fibers implanted into cortical amygdala. g, The mean performance index for mice exposed to 2-phenylethanol in the absence and presence of photoactivation (n=6). f,g, *P < 0.05, **P < 0.01, ***P < 0.001 paired t-test comparing PI with and without laser for each group; error bars indicate SEM.

