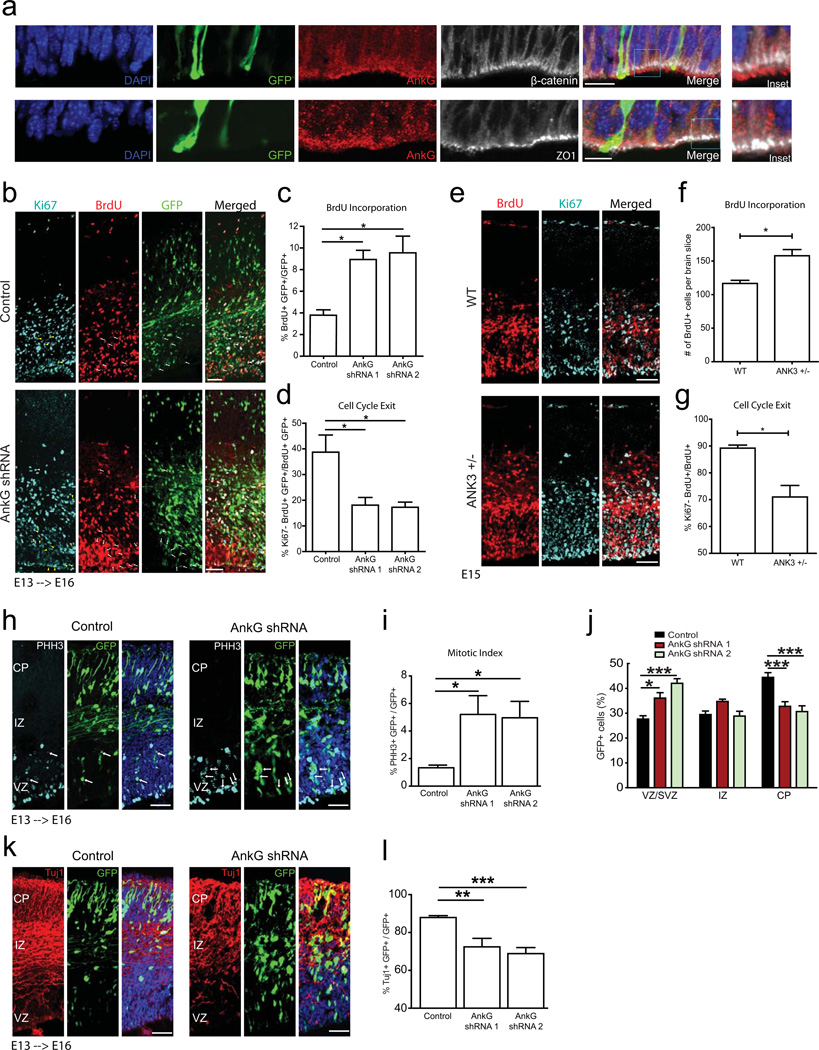
Figure 1. Ankyrin-G regulates progenitor cell proliferation in developing cortex.
a) Ankyrin-G (red) is highly expressed in the ventricular zone of developing cortex. b) Images of E16 mouse cortices electroporated at E13 with non-targeting (left panel, Control) and ankyrin-G-directed small hairpin (right panel, AnkG shRNA) and GFP expression plasmid. Single-pulse BrdU was injected 2 hour prior to brain dissection. Images were stained for GFP (green), BrdU (red) and Ki67 (white). Arrows indicate BrdU, GFP double-positive cells, and arrowheads indicate Ki67, BrdU, GFP triple positive cells. c) Ankyrin-G knockdown resulted in increased BrdU incorporation (Control, n=3; shRNA1 and shRNA2, n=4). d) Ankyrin-G knockdown decreased cell cycle exit (Control, n=3; shRNA1 and shRNA2, n=4). e) Images of E15 Ank3 +/− brains stained for BrdU (green) and Ki67 (white). Images were taking by keeping the width of the images constant, and covering all the cortical layers (VZ, SVZ, IZ and CP). f) Number of BrdU-positive cells per brain slice is significantly increased in Ank3 +/− animals compared to wild type littermates (WT, n=2; Ank3 +/−; n=3). g) Cell cycle exit in the BrdU-positive population is decreased in Ank3 +/− animals compared to wild type littermates (WT, n=2; Ank3 +/−; n=3). h) Images of E16 mouse cortices electroporated at E13. Images were stained for GFP (middle images in each set), PHH3 (left images in each set) and DAPI. Arrows indicate GFP, PHH3 double-positive cells. i) Ankyrin-G knockdown increased mitotic index as measure by PHH3 staining (Control, n=4; shRNA1 and shRNA2, n=3). j) Distribution of GFP+ cells in different cortical zones 72 hours after transfection at E16. Consistent with proliferative effect of ankyrin-G, percentage of GFP+ cells increased in the VZ/SVZ after ankyrin-G knockdown (Control, n=7; shRNA1, n=5 and shRNA2, n=6). k) Images of E16 mouse cortices electroporated at E13. Images were stained for GFP (middle images in each set), Tuj1 (left images in each set) and DAPI. l) Fraction of GFP+ cells overlapping with Tuj1staining is reduced after ankyrin-G knockdown (Control, n=7; shRNA1, n=5 and shRNA2, n=8). All analyses, one-way analysis of variance (one-way ANOVA) followed by Dunnett’s Multiple Comparison Test, except panel (f) and (g) where Unpaired t Test is used; *, P<0.05; **, P<0.01; ***, P<0.001. Scale bar: 10µm (a), 50µm (b, e) and 100µm (h, k).

