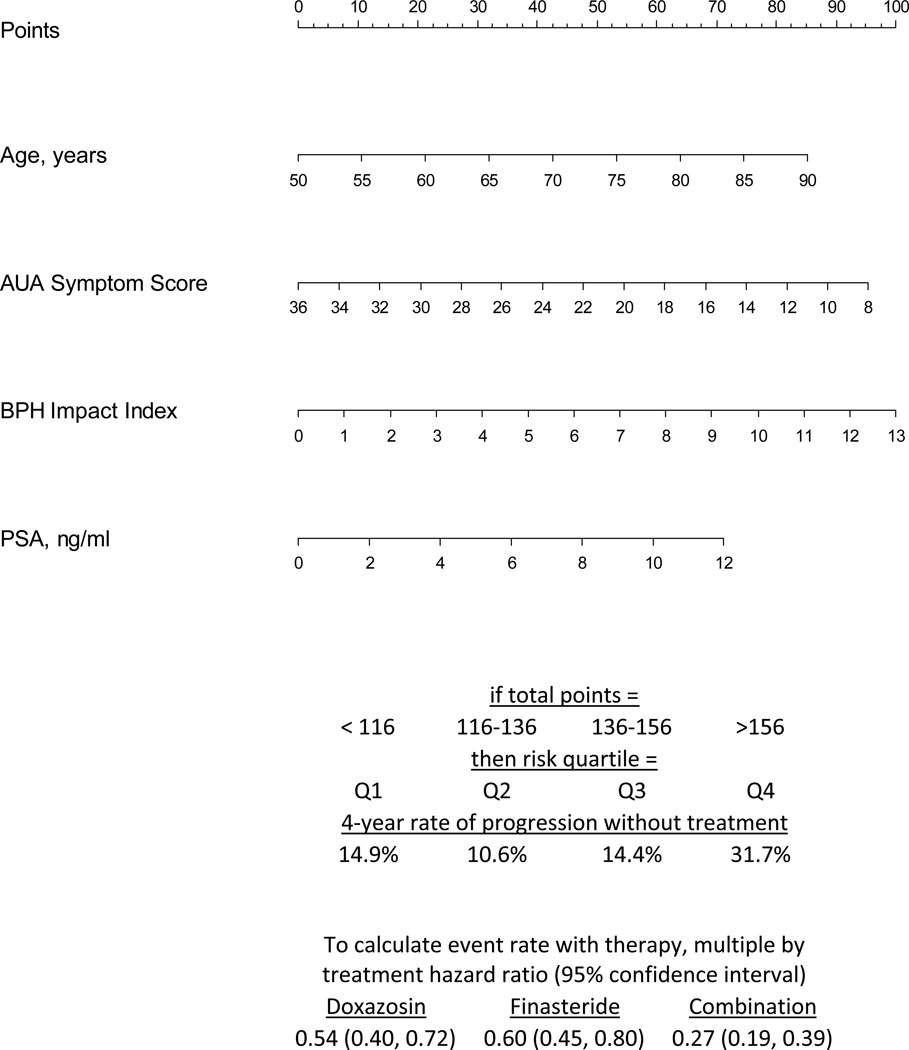
Figure 3.
Reduced Model--Clinical decision tool for predicting 4-year risk of clinical BPH progression using data from MTOPS, 4 predictor regression model. In order to determine an individual’s risk of progression, draw a vertical line from each of the patient’s factors to the “Points” line above. Add the four “Points” values together to arrive at a “Total Points.” Calculate the expected event rate with therapy by applying the hazard ratios below.

