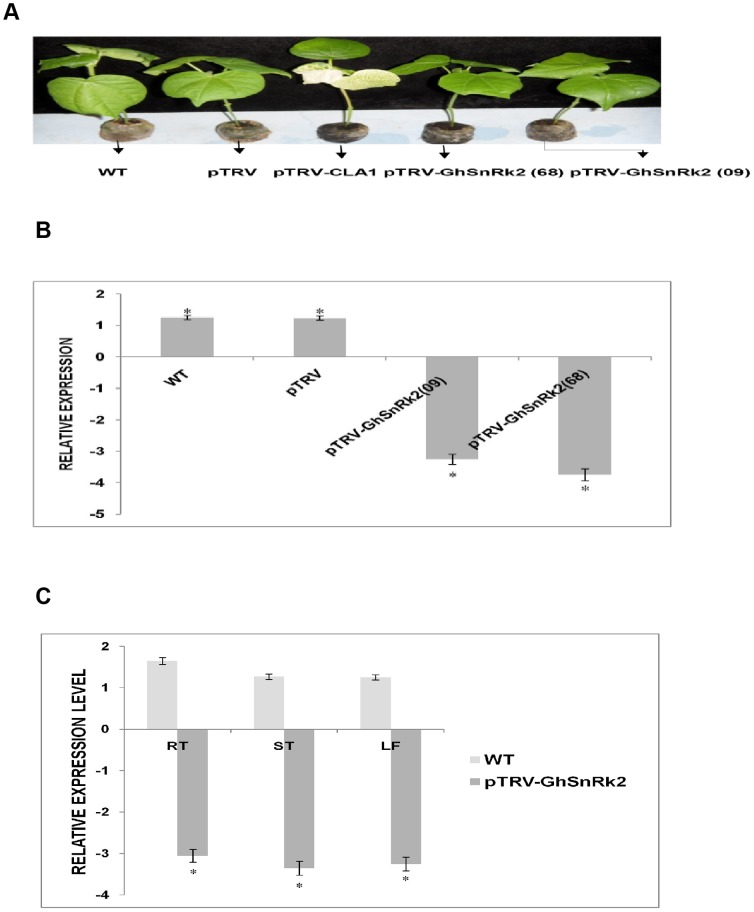
Figure 8. Silencing efficiency and transcript level of the GhSnRK2 gene silenced plants.
(A) Phenotype of gene silenced and non-silenced plants; 14 dpi. Wild-type (WT), negative control Empty vector (pTRV), positive control (pTRV-GrCLA1), gene silenced CRI409 cotton cultivars [pTRV-GhSnRk2 (09)], and gene silenced CRI99668 cotton cultivars [pTRV-GhSnRK2 (68)]. (B) The silencing efficiency as determined by the expression pattern of WT, vector control (pTRV) and GhSnRK2 gene silenced plants based on qRT-PCR. (C) The distribution of the TRV- construct in the gene silenced plants. Samples from the root, the stem and the leaves of gene silenced and non-silenced plants were analyzed via qRT-PCR. The values are presented as the means of three biological replicates. Asterisk denotes a significant difference (P<0.05).

