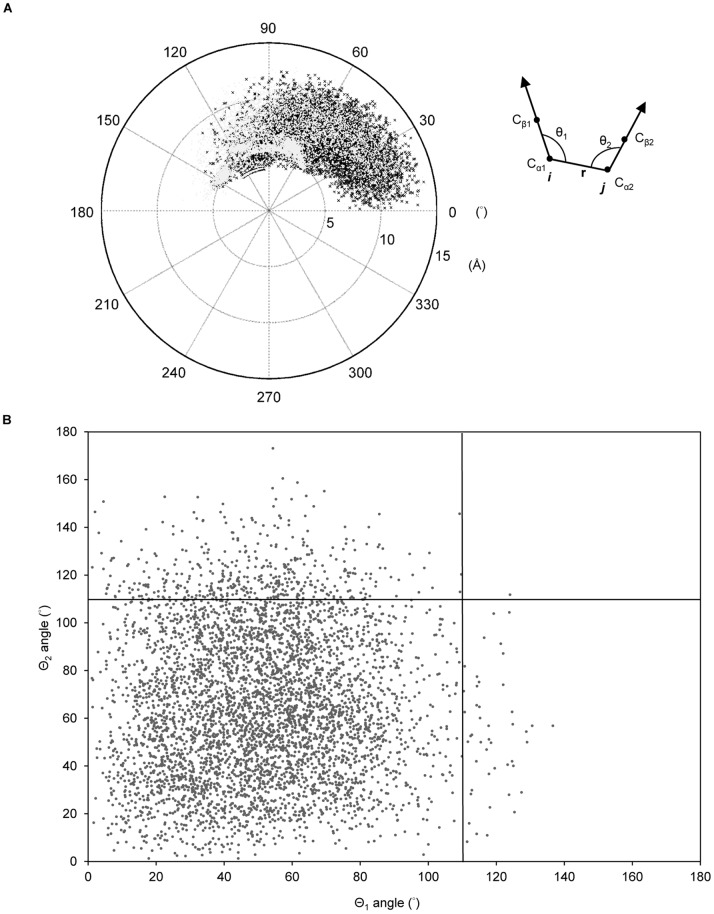
Figure 1. Spatial orientation and Cα–Cα distances of salt bridges on protein surfaces.
(A) Statitical analysis of angles (θ1, θ2) of 10,556 salt bridges on the surfaces of 6,493 X-ray protein structures. Two angles of a salt bridge (i–j), ∠Cβ1Cα1Cα2 (θ1) and ∠Cβ2Cα2Cα1 (θ2), were used to describe the charge group interaction based on the relative orientation of the two residues’ Cα–Cβ vectors as indicated. All of the angles are in the range of 0° to 180° (θ1 and θ2 color in black and gray). The length of radius are corresponding to Cα–Cα distance (Å). (B) The scatter plot shows the angles (θ1, θ2) of the salt bridges at a backbone distance >7 Å, which are restrained within 0° to 110°.

