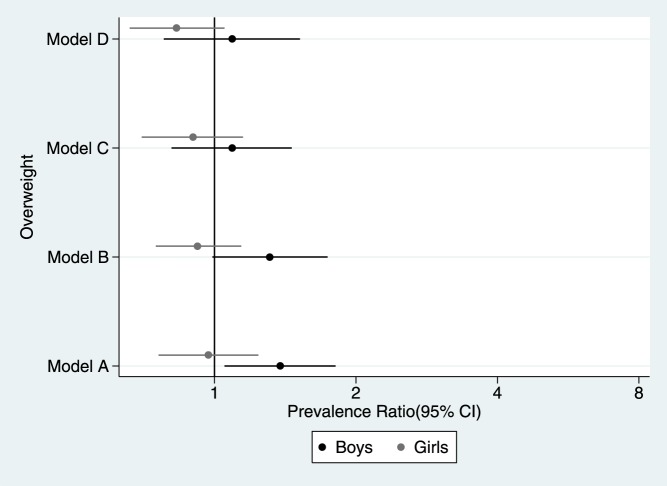
Figure 3. Prevalence ratio of overweight according to child gender.
Young Lives Study, 3° round younger cohort. Model A: crude exposure-outcome estimation. Model B: only adjusted for age, birth weight, total meals previous day and physical activity. Model C: only adjusted for maternal education, paternal education, maternal weight, location and wealth index. Model D: adjusted for all the co-variables.

