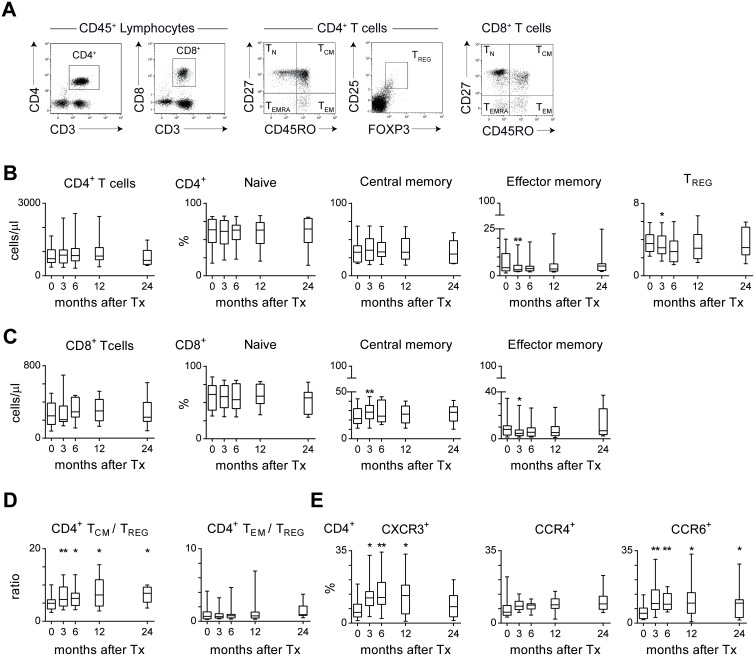
Figure 1. Subset distribution of circulating T cells in renal transplant recipients after treatment with tacrolimus, MMF and steroids over time.
(A) Representative dot plots for a renal transplant recipient showing CD3+CD4+ and CD3+CD8+ T cells within the CD45+ lymphocyte population. Circulating CD4+ and CD8+ T cells can be characterized as naive (TN; CD27+CD45RO−), central memory (TCM; CD27+CD45RO+), effector memory (TEM; CD27−CD45RO+) and highly differentiated memory (TEMRA; CD27+CD45RO−) cells. Furthermore, CD4+ T cells can be characterized as regulatory T cells (TREGS; CD25hiFOXP3+). (B) Shown are the absolute numbers of CD4+ T cells and the percentages of TN, TCM and TEM within the CD4+ T-cell population for 14 triple immunosuppression-treated patients before transplantation (t = 0) and at 3, 6, 12 and 24 months after transplantation (n = 10 at 24 m). (C) As described under B, for CD8+ T cells. (D) The ratio between the percentage of CD4+ TCM or TEM and the percentage of TREGS. (E) Longitudinal analysis of the percentages of CXCR3+, CCR4+, and CCR6+ cells within the CD4+ T-cell population of 14 triple immunosuppression-treated patients (n = 10 at 24 m). Results are shown as box plots displaying the median, 25th and 75th percentiles as the box, and the 5th and 95th percentiles as whiskers. Significant differences are indicated compared to pre-transplant levels: *P<0.05, **P<0.01.

