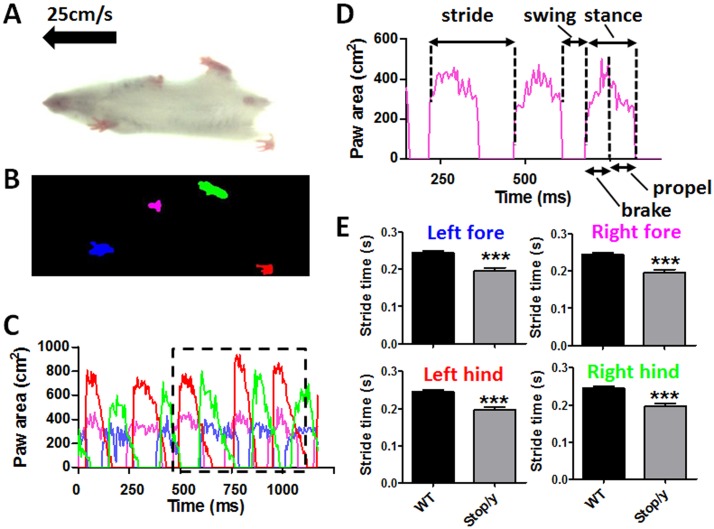
Figure 1. Treadmill-based measurement of gait properties in Mecp2stop/y mice.
(A) Video still image showing mouse walking on transparent treadmill (viewed from below) at 25 cm/s. (B) Placement of each paw is detected from the video illustrated in (A). (C) Graph of paw area in contact with the treadmill surface for each paw over time (one session, one animal); the area outlined in black has been replotted in (D). (D) Excerpt from (C) showing calculated paw area in contact with treadmill surface over time for a representative single paw (right fore; pink in B and C), from which multiple stride indices can be obtained (labeled). (E) Column plots showing stride time measures (mean +/− SEM) for each limb in 8 week old wild-type (WT) and Mecp2stop/y mice (***p<0.001 relative to WT; t-test, n = 5 per genotype).

