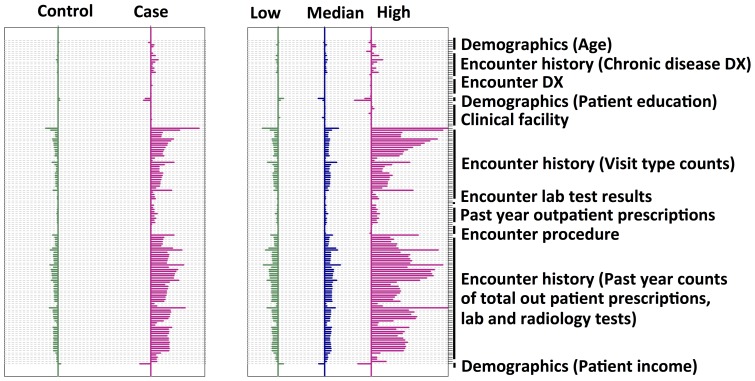
Figure 4. Characterization of the discriminant features in the prospective data set.
Shrunken difference for the selected features to develop the ED risk model were graphed in order to measure the feature abilities in discriminating different classes. The x axis is the shrunken difference of each feature listed along the y axis, which is a measure of the difference between the standardized mean value of a feature within a specific class and the overall mean value of that feature. Comparing the two cohorts (case/control or the low/medium/high risk), the shrunken differences of these discriminative features were much more pronounced in the low/medium/high risk cohort, demonstrating the effectiveness of these features in prospectively differentiating the targeted outcomes.

