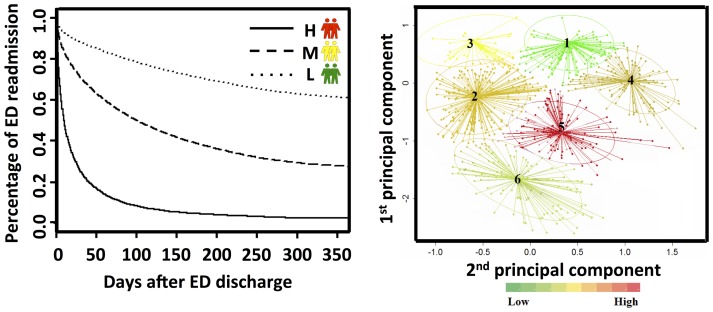
Figure 7. The ED predictive algorithm effectively risk-stratified the prospective patient cohort for future 30-day ED visit.
Left panel: “Time to event” graphic representation of the low, medium and high risk patients' time to the next impending ED visit. Right panel: Unsupervised clustering of the high-risk patients identified distinct subgroups in the prospective cohort. Color-coding reflects the average cost of the high-risk patients in the next 30-day post discharge.

