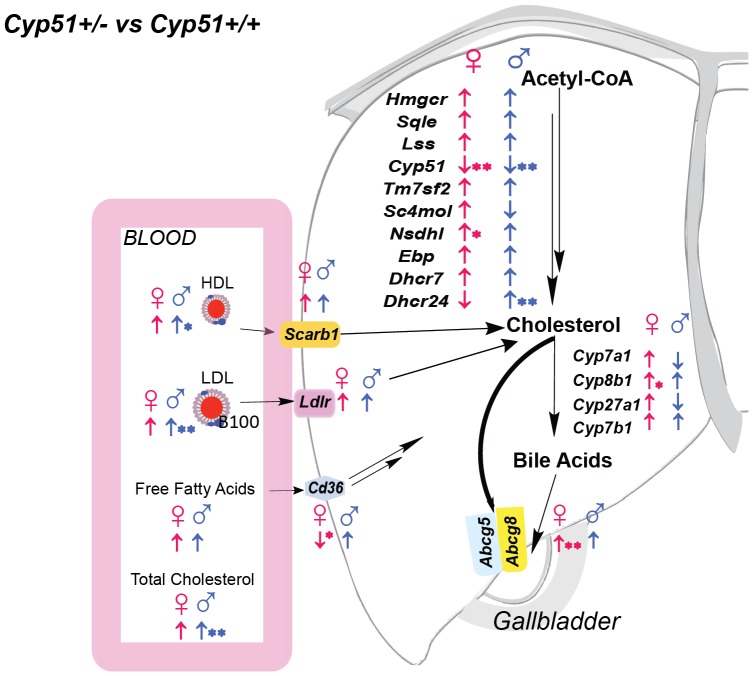
Figure 3. The global effect of Cyp51 haploinsufficiency.
The genotype effect shown on blood lipid profile (n = 8–15) and hepatic gene expression analyses in Cyp51+/− mice compared to Cyp51+/+ matched with sex (n = 4–7) and blood lipid profile differences. The direction of arrows indicate (↑) up-regulation or (↓) down-regulation of expression in heterozygous females (♀) and males (♂). The direction of arrows shows also a trend of change in genes that did not reach statistical significance. *(p<0.1); **(p<0.05). Results are joined for all diets.

