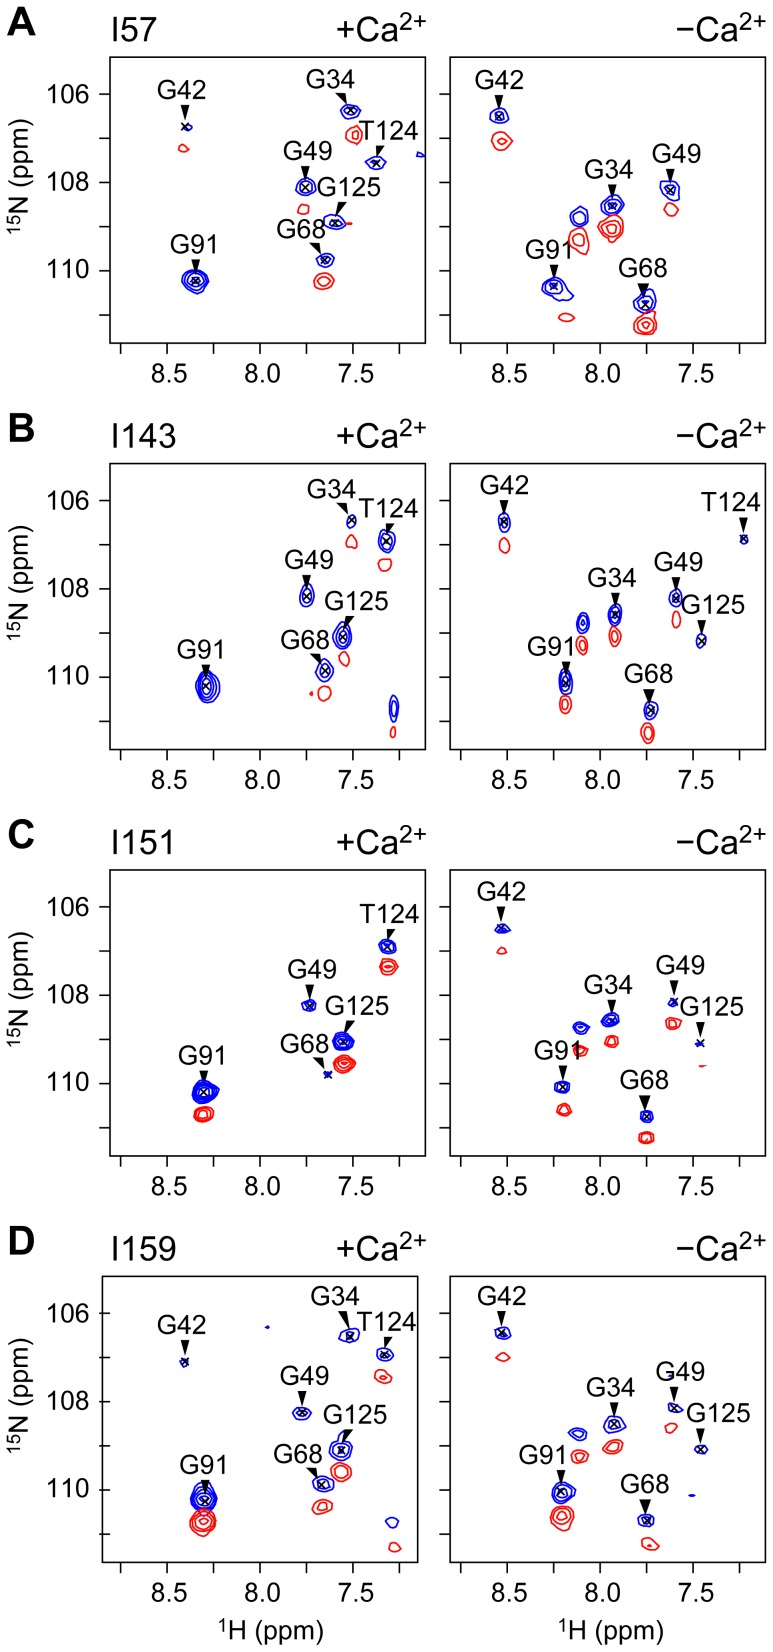
Figure 2. Strong peak broadening due to the PRE effect was observed in cTnC residues in the vicinity of each cTnI spin label.
The glycine-containing region of the paramagnetic (red) and diamagnetic (blue) 1H-15N-TROSY spectrum of each spin-labeled binary cTnC-cTnI construct. The MTSL spin label is attached to cTnI residues (A) I57, (B) I143, (C) I151 and, (D) I159. Spectra are shown for +Ca2+ (left panels) and −Ca2+ conditions (right panels). The superimposed paramagnetic spectrum is offset by 0.5 ppm in the 15N dimension for clarity.

