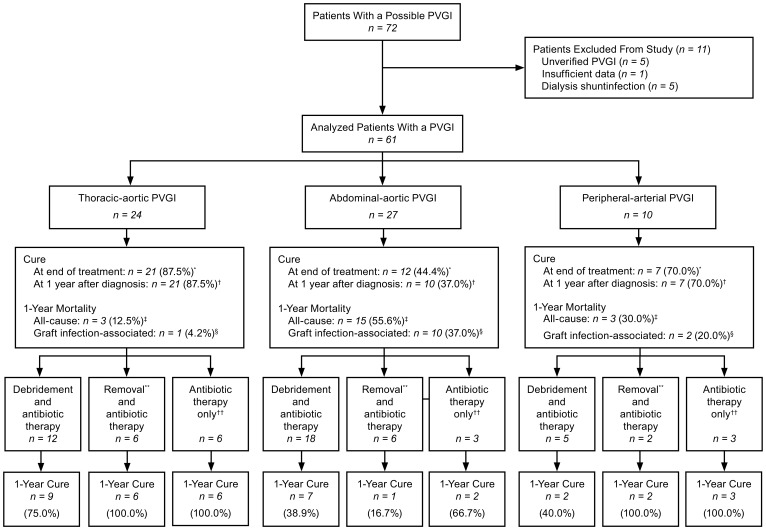
Figure 1. Comparison of primary and secondary outcomes in the treatment of prosthetic vascular graft infection.
PVGI = prosthetic vascular graft infection. *p-value = 0.006. †p-value = 0.001. ‡p-value = 0.004. §p-value = 0.012. **Removal or replacement of the infected vascular graft. ††No surgical intervention; antimicrobial treatment only.

