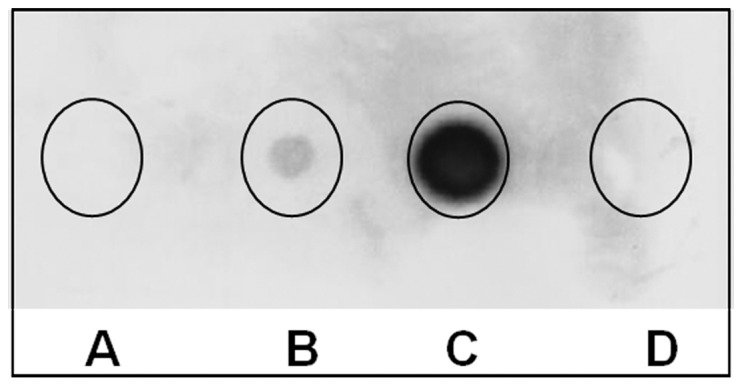
Figure 6. Dot blotting analysis of the FMDV VP1 G-H loop displayed on Qβ phages with SD6 mAb.

Spot A: Supernatant of the Qβ wild-type culture infection (negative control); Spot B: Qβ-G-H loop phages from the supernatant of culture after 5 h of infection; Spot C: Qβ-G-H loop phages from the supernatant after overnight infection (higher concentration); Spot D: the phage buffer only as a negative control. Phages from spots A, B and C were purified by PEG8000/NaCl precipitation and CsCl gradient. The same pattern was obtained with the spotted corresponding crud lysat.
