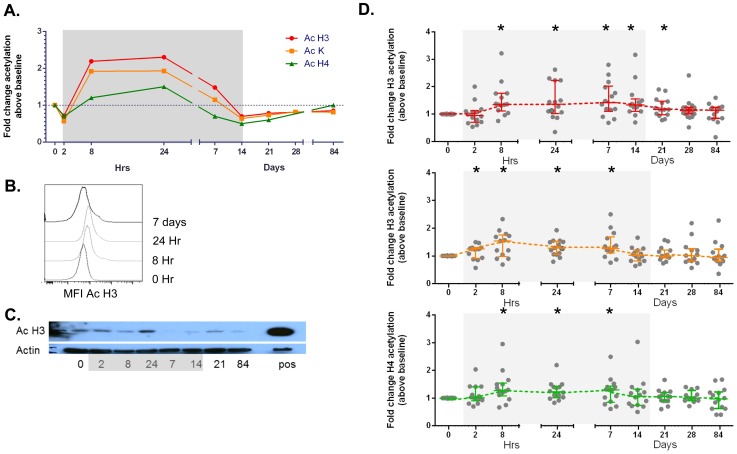
Figure 1. Induction of changes in acetylation of histone 3, histone 4 and lysine by vorinostat.
Changes in histone (H) acetylation were quantified using flow cytometry which is shown (for representative participant) as (A) fold change in mean fluorescence intensity (MFI) of antibody to acetylated (Ac) H3, Ac lysine (K) and Ac H4 in lymphocytes by size prior to, during and following vorinostat and (B) histograms of the change in MFI with antibody to Ac H3 following vorinostat. (C) PBMC were analysed by western blot using an antibody to Ac H3 and actin (as a control for total protein). A positive control (pos) of splenocytes from a mouse with acute myeloid leukemia treated with the HDACi panobinostat is also shown. (D) Fold change in acetylated (A) Histone 3 (red), (B) Lysine (orange) and (C) Histone 4 (blue) in total lymphocytes is shown for each study participant (solid circle) and the median (IQR) fold change above baseline is shown. *p<0.01, **p<0.001. Grey shaded box represents the time on vorinostat.

