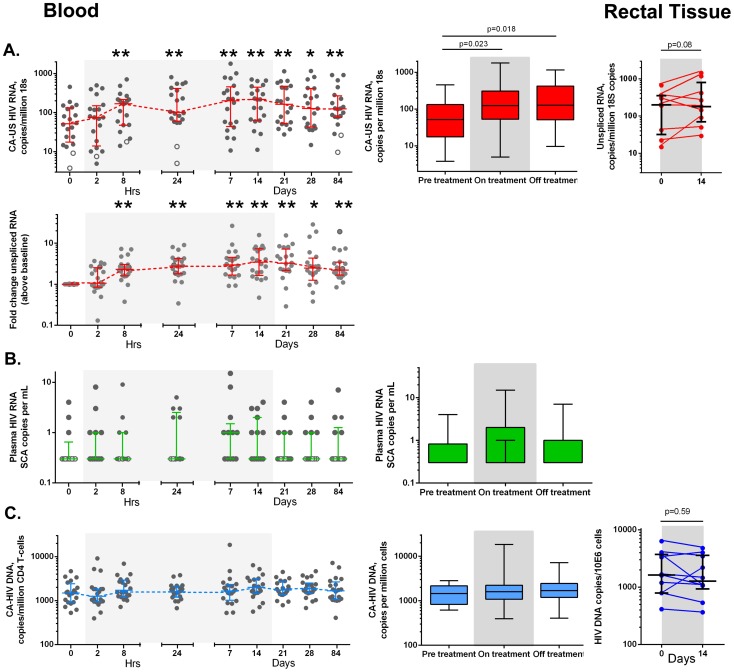
Figure 3. Effects of vorinostat on CA-US HIV RNA, HIV DNA and HIV RNA in blood and tissue.
Changes in (A) CA-US HIV RNA (red), (B) plasma HIV RNA (green) and (C) HIV DNA (blue) is shown for each study participant (solid circle) and the median (IQR) at each time point in CD4+ T-cells from blood (left panel) and rectal tissue (right panel). Open circles represent data when at least one of the replicates were below the lower limit of detection (LLOD). The mean fold change in each parameter is also shown using a generalised estimating equation analysis (middle panel; boxes represent the median, 50th and 75th percentiles and whiskers represent the range). Grey shaded box represents the time on vorinostat. *p<0.01, **p<0.001.

