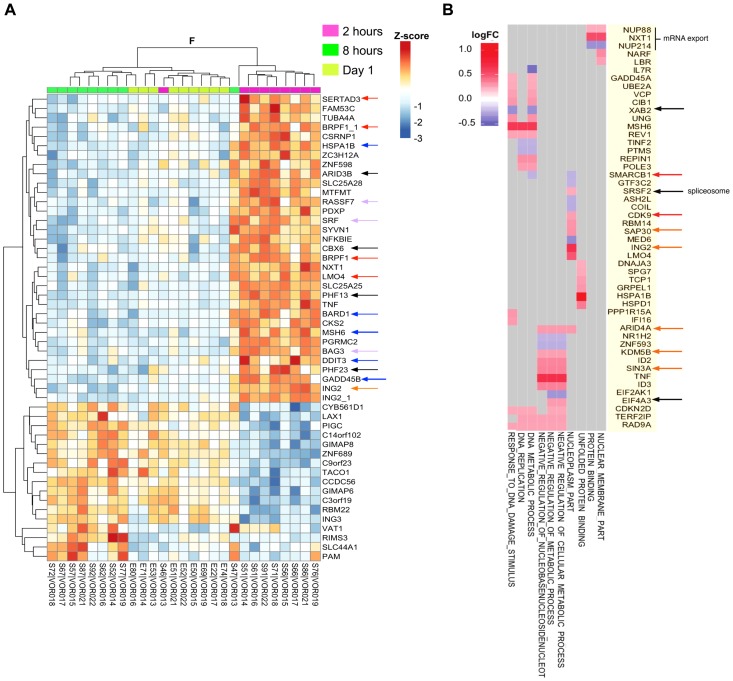
Figure 6. Vorinostat induced a transcriptional burst and chromatin perturbations that are recurrent with subsequent dosing.
(A) ANOVA (F-test) heatmap of top 50 differentially expressed genes (DEGs) from matched donor supervised analysis (n = 9) comparing gene expression two hours (2 h), eight hours (8 h) and one day following the initial dose of vorinostat. Gene expression was adjusted for baseline expression and represented as a gene-wise standardized expression (Z-score), with p-values<0.05. DEGs are annotated with colored arrowheads: red, transcription coactivators and adaptors; blue, DNA damage and ER stress response; purple, apoptosis resistance; black, chromatin remodeling factors; orange, mSIN3a histone-deacetylase complex subunits. (B) Checkerboard map of DEG two hours after the initial dose of vorinostat compared to baseline showing the top 10 enriched pathways on the x-axis and leading edge analysis (gene members contributing most to enrichment) plotted along the y-axis. Scale represents log2 fold change where red corresponds to up- and blue down-regulated genes at two hours versus baseline. Genes associated with viral transcriptional activity are annotated with colored arrowheads: red, BAF component SMARCB1 (SNF5) and CDK9; black, splicesome and nuclear export proteins; orange, mSIN3A HDAC subunits.

