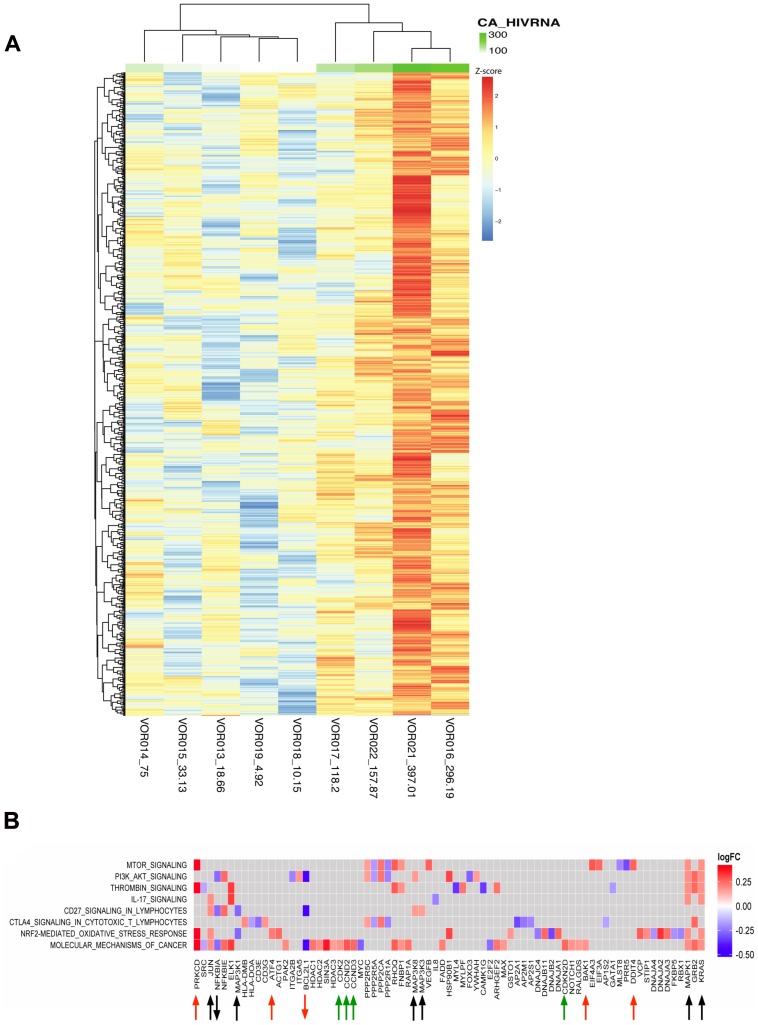
Figure 7. Changes in host genes were associated with an increase in CA-US HIV RNA after vorinostat.
(A) Heatmap showing the fold change in gene expression using linear regression analysis between CA-US HIV RNA and DEG at two hours following the initial dose of vorinostat (n = 9). CA-US HIV RNA is plotted as a continuous variable (ranging from low to high – light green to dark green) and correlated with distinct gene expression profiles. The copy number of CA-US HIV RNA per million cells two hours following vorinostat for each participant is listed next to the patient identification code at the bottom of each column. The top 50 regression features (of a total of ∼2000 at nominal p-value<0.05) are shown. (B) Pathway analysis was performed on the regression features and a checkerboard map showing the top common enriched pathways on the y-axis and leading edge analysis (gene members contributing most to enrichment) plotted along the x-axis. Up- and down-regulated genes at two hours versus baseline are plotted as log2 fold change (FC); red squares correspond to upregulated gene expression and blue downregulated gene expression. Genes associated with MAPK signal transduction pathways are annotated with black arrows and cell cycle regulators annotated with green arrows. Genes associated with the ER stress response and apoptosis are annotated with red arrows.

