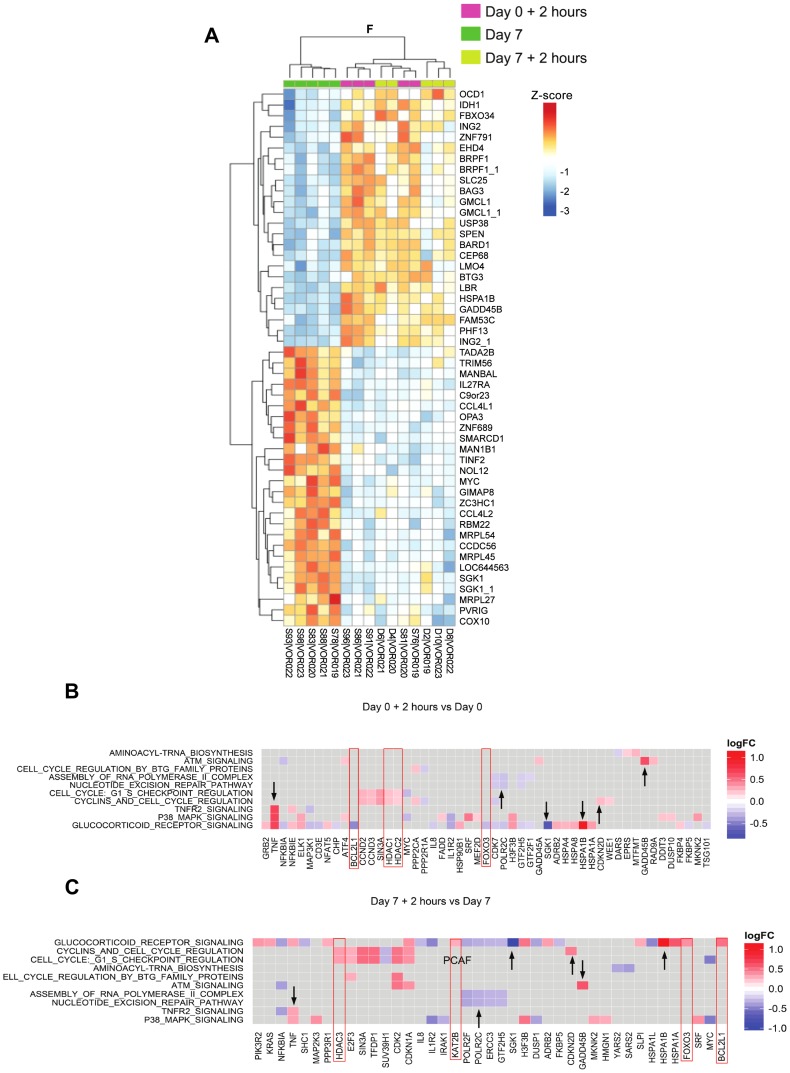
Figure 8. Similar gene expression and pathway activity after the 1st and 7th daily dose of vorinostat.
(A) ANOVA (F-test) heatmap of top 50 DEGs from matched donor supervised analysis (n = 5) comparing gene expression at 2 hours following the first dose (day 0+2 hours), day 7 (7d; prior to the seventh dose), and two hours following the seventh dose (day 7+2 hours). Gene Expression was adjusted for baseline expression and represented as a gene-wise standardized expression (Z-score), with p-value<0.05. The heatmap shows hierarchical clustering of day 0+2 hour and day 7+2 hour timepoints for each subject indicative of highly congruent gene expression profiles. Checkerboard maps of DEG (B) two hours following the initial dose of vorinostat compared to baseline and (C) two hours following the seventh dose of vorinostat compared to prior to the seventh dose. The top 10 common enriched pathways are shown on the y-axis and leading edge analysis (gene members contributing most to enrichment) is plotted along the x-axis. Scale represents log2 fold change. Genes up- or down-regulated similarly between the two time-points are indicated by black arrowheads whereas genes highlighted in red boxes are inversely or differentially regulated between time points.

