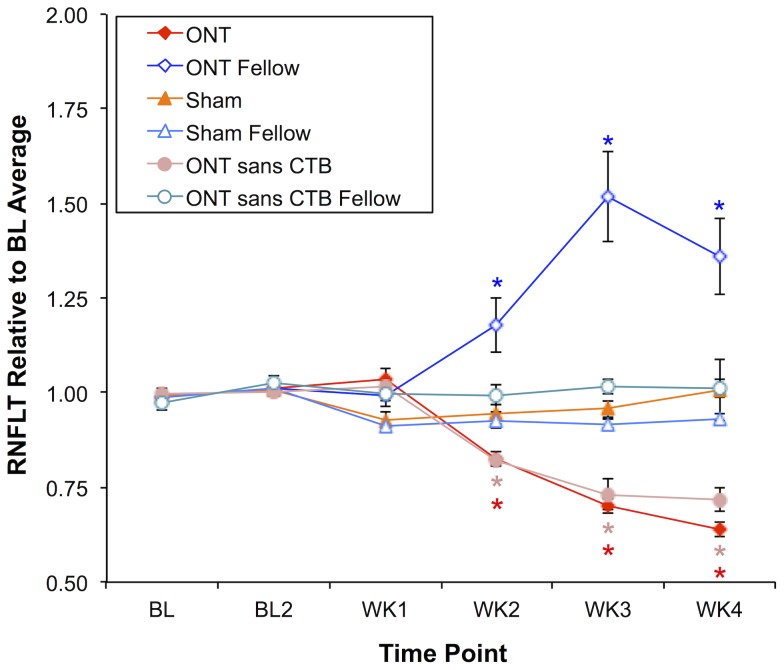
Figure 2. Longitudinal measurements of RNFLT for all three experimental groups.
Values of RNFLT were normalized to the baseline average of each eye; symbols represent the group average, error bars indicate SEM. RNFLT decreased in Group-1 ONT eyes by 17%, 30% and 36% at weeks 2, 3 and 4. Group 2 operated eyes (“ONT sans CTB”) exhibited a similar pattern of longitudinal RNFLT change. In Group-1 ONT fellow eyes, RNFLT increased by 18%, 52% and 36% at weeks 2, 3 and 4. There were no significant differences from baseline for any group at week-1. There was no significant change in RNFLT at any follow-up time point in Group-2 non-operated fellow control eyes (“ONT sans CTB Fellow”), Group-3 sham operated (“Sham”) or Group-3 fellow control eyes (“Sham Fellow”). *Significant change from baseline assessed by two-way repeated measures ANOVA with Bonferroni post-hoc tests on raw values (see text for details).

