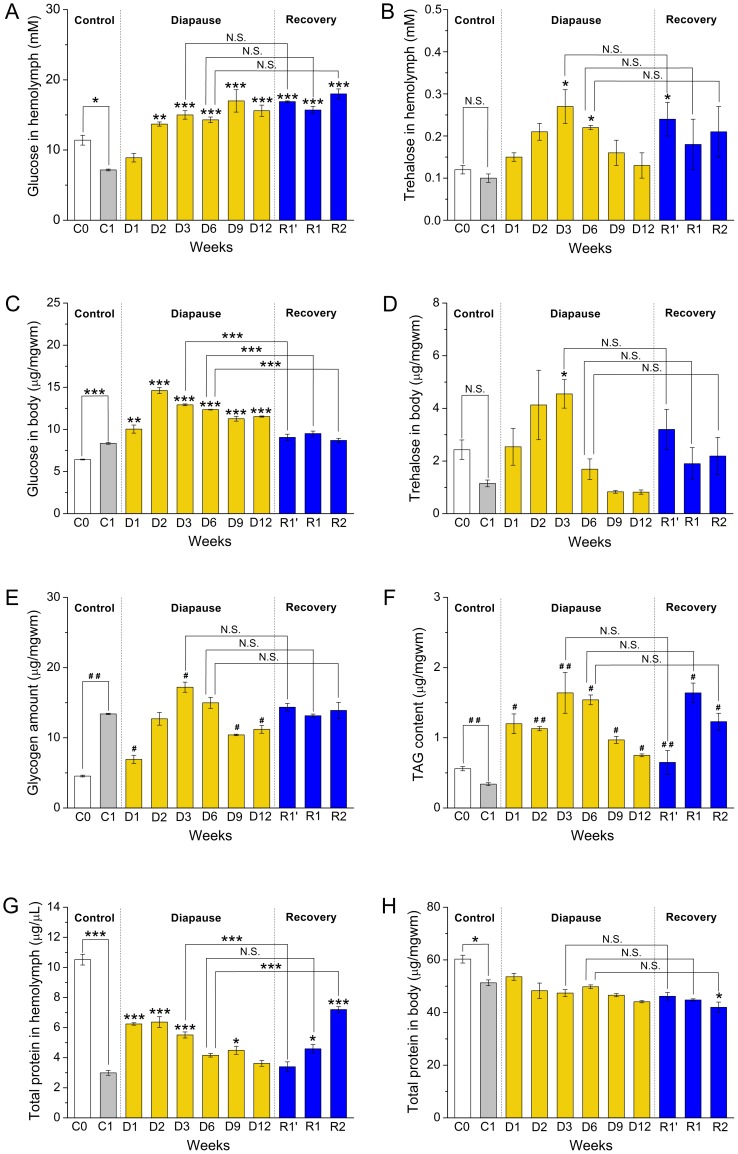
Figure 3. Diapause conditions affect circulating and stored carbohydrates and proteins as well as stored lipids in Canton S.
Flies were kept under the same conditions as in Fig. 2A. In the panels data are presented as means ± S.E.M, n = 5–6 independent replicates with 10–15 flies in each replicate. Data significantly different from the flies kept for one week at normal conditions (C1) are indicated * p<0.05, ** p<0.01, ***p<0.001, N.S. not significantly different (ANOVA followed with Tukey test) or with # p<0.05, ## p<0.01 or #### p<0.01 (Kruskal–Wallis test followed by pairwise comparisons using Wilcoxon rank sum test). A Glucose concentrations in hemolymph (mM) are significantly increased throughout diapause as compared to the flies kept at normal conditions for one week (C1). After recovery from diapause (R1′–R2) glucose levels remain high. B Trehalose levels in hemolymph increase to a peak at three weeks of diapause (D3) and then return to the control level (C1). Recovery conditions have no effect on trehalose. C Whole body glucose also increases significantly during diapause, but falls after recovery compared to controls (C1). D Whole body trehalose stores increase significantly to a peak at three weeks diapause (D3) and drop thereafter to very low levels, similar to one week controls (C1). E Compared to the 1 week controls (C1) glycogen stores first drop (D1) and then increase with a peak at three weeks of diapause (D3). During recovery (R1′, R1 and R2) flies restore glycogen to the control (C1) value. F Triacylglycerid (TAG) contents increase significantly and also peak after three weeks of diapause (D3) and remain elevated compared to C1. G The total protein in the hemolymph is elevated during 1–3 weeks of diapause (D1–D3) compared to 1 week control flies (C1). After recovery from three weeks of diapause protein levels remain reduced, but after 2 weeks of recovery from 6 weeks of diapause proteins are elevated in the hemolymph. H The total body protein is similar to the one week non-diapausing controls (C1) throughout diapause. See also Fig. S5, S6 and S7E–L in File S1 for comparisons of metabolite levels in dilp mutants and w1118.

