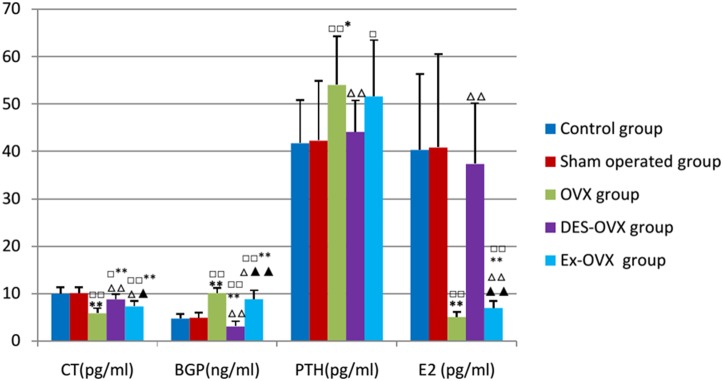
Figure 3. CT, BGP, PTH, and E2 in the five groups.

compared with the control group: □ p<0.05, □□ p<0.01; compared with the sham-operated: *p<0.05, **p<0.01; compared with the OVX group: △ p<0.05, △△ p<0.01; compared with the DES-OVX group: ▴ p<0.05, ▴▴ p<0.01.
