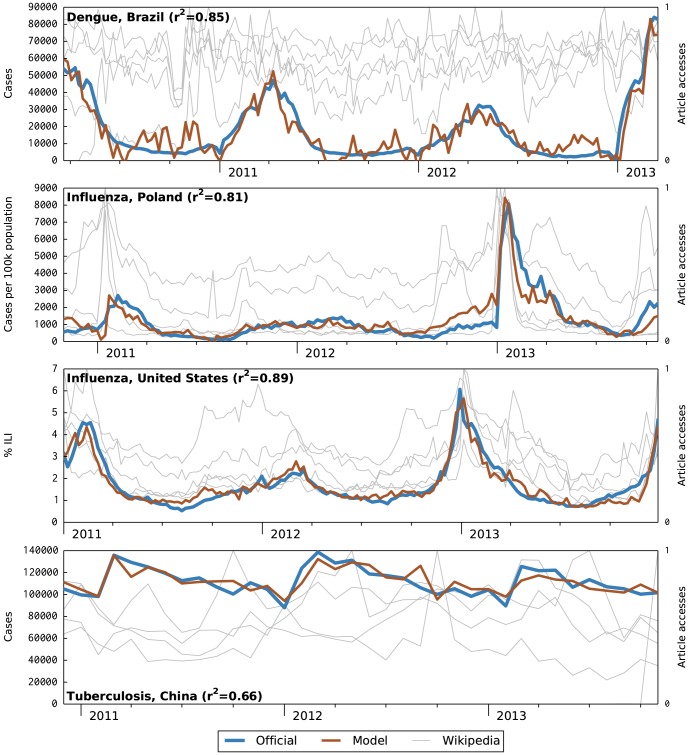
Figure 1. Selected successful model nowcasts.
These graphs show official epidemiological data and nowcast model estimate (left Y axis) with traffic to the five most-correlated Wikipedia articles (right Y axis) over the 3 year study periods. The Wikipedia time series are individually self-normalized. Graphs for the four remaining successful contexts (dengue in Thailand, influenza in Japan, influenza in Thailand, and tuberculosis in Thailand) are included in the supplemental data file S1.

