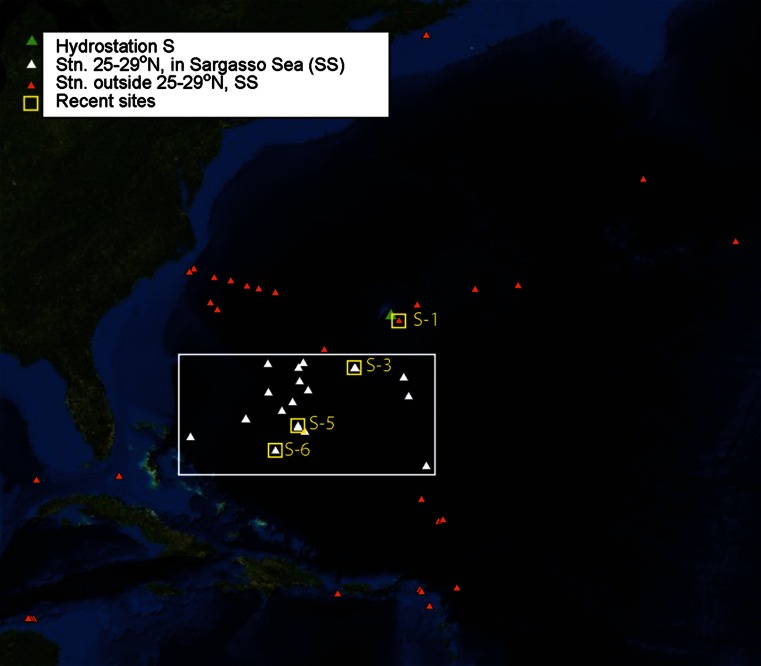
Fig. 1.
Study area map: stations of recent sample stations (small yellow boxes, stations numbered 1, 3, 5, and 6) and historical sample stations (Weis 1968; Fine 1970; Butler et al. 1983) including Hydrostation S in green. Samples used for direct comparison across time series in Sargasso Sea, 25°–29°N (“restricted block”) depicted by white triangles inside larger white box. Additional historical stations included in broader analysis of all samples shown as orange triangles. Long time-series records of sea surface temperature and pCO2 recorded in vicinity of Hydrostation S. Map prepared in ArcMap 10.1

