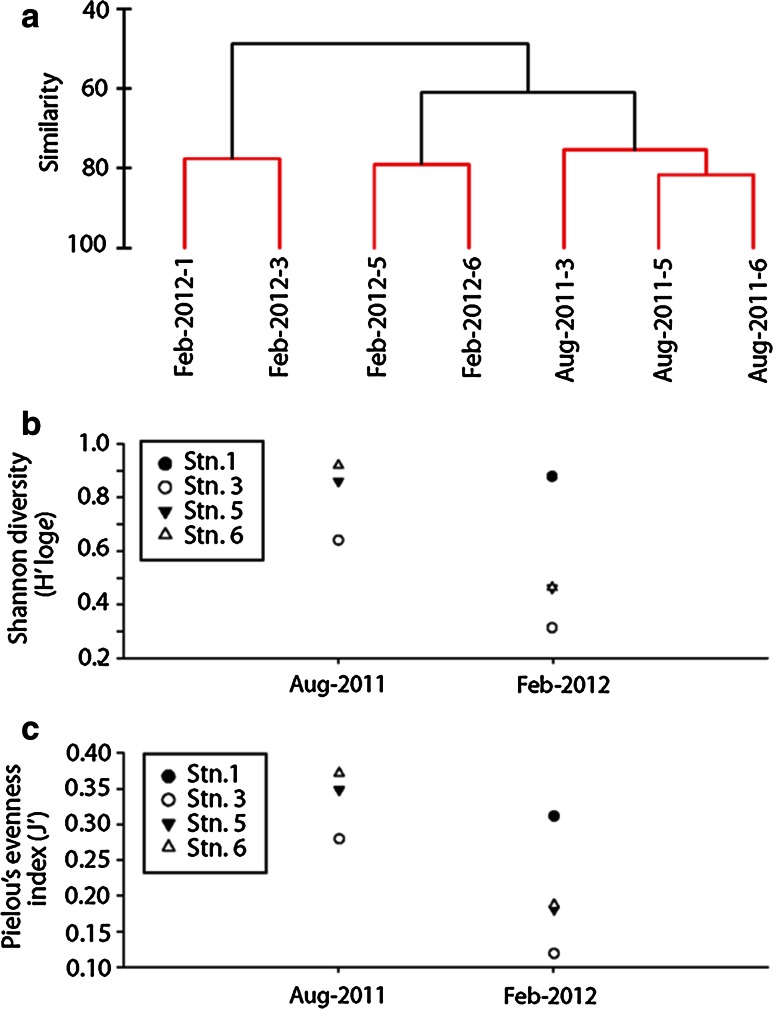
Fig. 3.
Mobile macrofauna community composition (MMCS) similarity, diversity, and evenness for Sargasso Sea stations examined, Aug 2011 and Feb 2012. a Cluster diagram showing percent similarity between samples. MMCS >48 % similar across sampling periods. Red lines denote statistically significant clustering according to the Simprof test, b Shannon diversity by recent cruise date. Station 1 (black dot) lies north of Sargasso Sea, 25°–29°N restricted block c) Pielou’s evenness index by recent cruise date. Station 1 (black dot) lies north of Sargasso Sea, 25°–29°N restricted block

