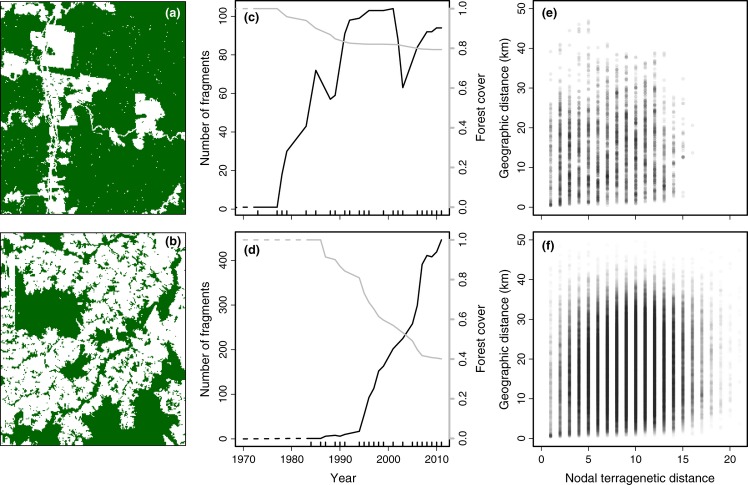
Figure 2.
Terragenetic patterns in the Manaus (top row) and Machadinho d'Oeste (bottom row) landscapes. (a,b) Maps of the study landscapes show the present-day (2011) distribution of primary forest (green). Both landscapes are 1254 km2 (33 × 38 km). (c,d) Temporal dynamics of the study landscapes through time, as reconstructed from time series maps of land cover. Panels show the number of forest fragments (black line, left axis) and the proportion of forest cover (grey line, right axis) through time. Dashed lines indicate values that were not directly observed. Internal tick marks on the x-axis represent time points when land cover was observed. (e,f) Correlation between nodal terragenetic distance and geographical distance as measured by the distance between fragment centroids. Points are semi-transparent, so darker areas correspond to higher point density.

