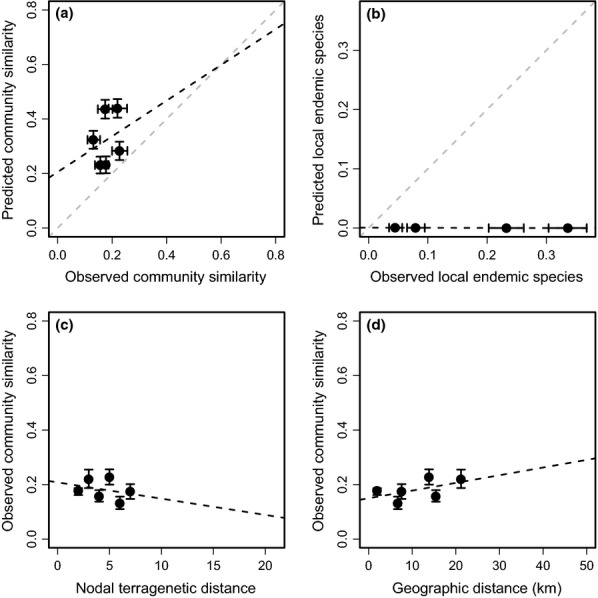
Figure 6.

Empirical validations of the ability of the terragenetic model to predict patterns of leaf-litter beetle community composition in the Manaus landscape. (a) Observed vs. predicted community similarity and (b) observed vs. predicted proportion of locally endemic species. Grey dashed line shows the 1 : 1 relationship that would be followed if the model made perfect predictions. Observed community similarity (c) declines with increasing terragenetic distance between fragments but (d) increases with geographical distance between fragments. In all panels, black dashed lines show the relationship fitted using linear regression. Error bars represent the 95% confidence interval around predicted and observed values. Terragenetic predictions were generated using a z-value for the SAR of 0.11. Community similarity is represented as Jaccard similarity and represents the proportion of species that are common to any given pair of habitat fragments.
