
Figure 1.
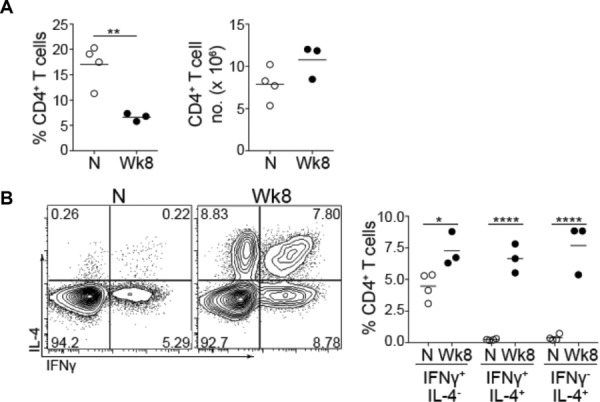
IFN-γ+IL-4+ cells are generated during Schistosoma mansoni infection. Splenocytes were isolated from infected mice taken from the same experiment (Wk 8) or uninfected age-matched controls (N). (A) The proportion and number of splenic CD4+ T cells was assessed by flow cytometry. Each symbol represents an individual animal and the mean of each sample group is shown as a horizontal line. Statistical significance was assessed using a Student's t-test and data are representative of two independent experiments. (B) Purified splenic CD4+ T cells were stimulated with PMA, ionomycin, and GolgiStop. FACS plots show intracellular staining of IFN-γ and IL-4. Dead cells, doublets and TCR-β−CD4− cells were excluded prior to assessing cytokine expression (Supporting Information Fig. 1). Plots are representative of five independent infections where either pools of spleens were analyzed or animals were analyzed separately. Results were similar in both cases. The percentage of splenic CD4+ cells expressing IFN-γ alone, both IFN-γ and IL-4, or IL-4 alone for individual mice taken from the same experiment are plotted on the right hand side of the figure, significance was assessed using two-way ANOVA. *p < 0.05, **p < 0.01 and ****p < 0.0001.