
Figure 3.
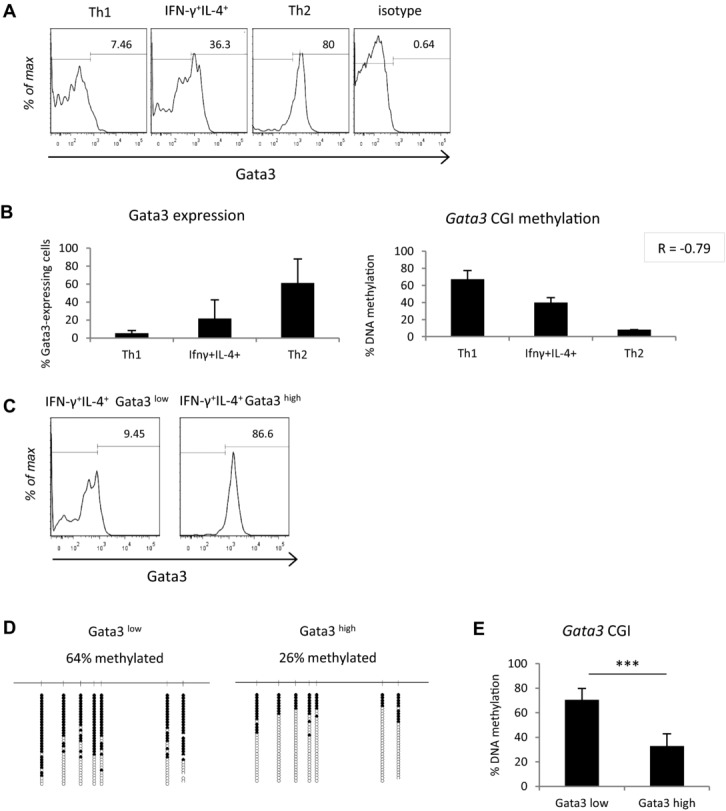
Gata3 gene body CGI methylation negatively correlates with gene expression. (A) Gata3 expression as assessed by flow cytometry in Th1, Th2, and IFN-γ+IL-4+ cells. (B) The percentage of Gata3-expressing cells in spleens isolated from S. mansoni infection is plotted alongside the overall percentage DNA methylation, as assessed by bisulfite sequencing, at the Gata3 CGI for each cell population. Pearson's correlation coefficient (R) for the two datasets is shown in top right hand corner. (C) Sorting of IFN-γ+IL-4+ cells into Gata3low and Gata3high cells by FACS. (D) Gata3 methylation of Gata3low and Gata3high cells as quantified by bisulfite sequencing, labelling as in Fig.2. (E) Mean Gata3 gene body CGI methylation levels in Gata3low and Gata3high cells. Statistical significance was assessed using QUMA software and Mann–Whitney U test, ***p < 0.001. (A, C, D) Data shown are from a single experiment, representative of two independent experiments performed. (B, E) Data are shown as mean + SD of two independent experiments. FACS experiments are gated on FSC-A and SSC-A, FSC-A and FSC-W, CD4 expression, and lastly on IFN-γ and IL-4 production.