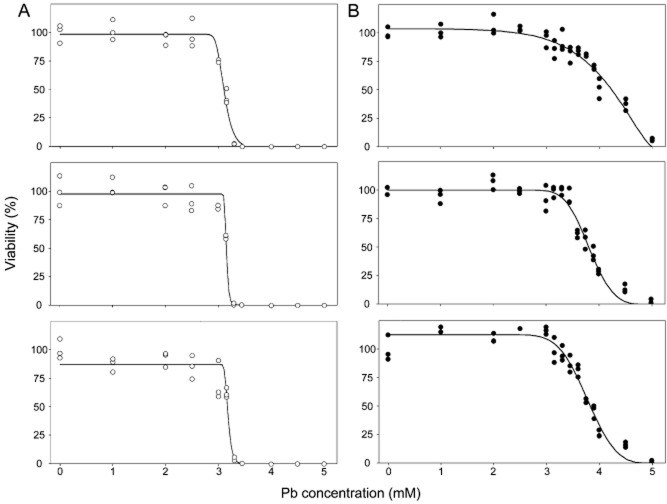
Figure 1.
Analysis of heterogeneity. Sample data for C. sake isolates from control and Pb-polluted locations. The plots show triplicate independent experiments for each of two example isolates: (A) The least heterogeneous isolate, D1-9, isolated from the control location. (B) The most heterogeneous isolate, D14-7, isolated from the Pb-polluted location. As described in the Methods section, heterogeneity in the relevant stress-resistance phenotype (Pb resistance in this example) was determined from the gradients of the slopes at the point where there was 50% inhibition of colony formation. IC50 was determined from the stressor concentration determined to give 50% inhibition of colony formation.

