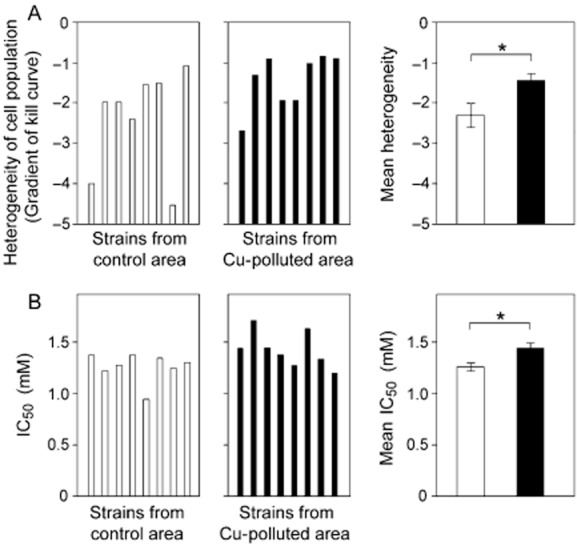
Figure 2.

Heterogeneity of C. podzolicus isolates near a Cu-polluted mine site. Independent isolates of C. podzolicus obtained from control (□) or Cu-polluted (▪) locations at Site 1 were spread plated to MYP agar supplemented with different Cu(NO3)2 concentrations. Colonies were enumerated after 14 days, and dose-response curves were constructed. Heterogeneity was determined from the gradients of the slopes (A), and IC50 from the Cu concentration that inhibited colony formation by 50% (B). Note that a high negative value (e.g. −4) indicates a steep gradient and low heterogeneity, whereas a low negative value (e.g. −1) indicates a shallow gradient and high heterogeneity. Data for each isolate are means from three independent experiments, each performed in triplicate. Isolates are presented in the same order in (A) and (B). The panels on the right show mean values ± SEM of the individual isolate data, which are presented in the left and centre panels. * P < 0.05.
