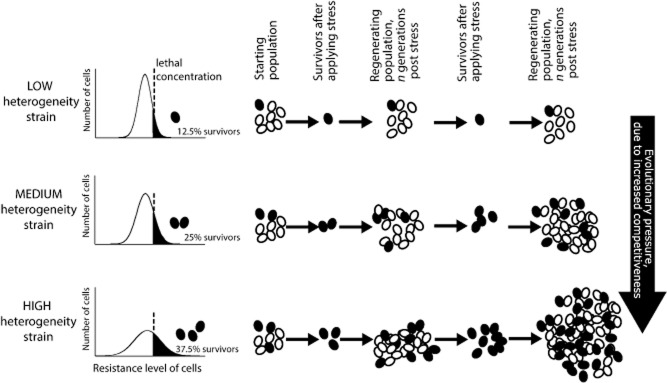
Figure 7.

Schematic showing how the selective pressure of stress favours heterogeneous organisms. Three example strains are illustrated, with the same mean resistances to a given stress (approximating to the peaks in the histograms) but with different heterogeneities (reflected by histogram width). In the low-heterogeneity strain, 12.5% of cells fall above the survival threshold at the indicated stressor dose, whereas the medium- and high-heterogeneity strains comprise 25% and 37.5% survivors at the same dose respectively. For clarity in this example, each round of stress application is followed by a recovery period (of three generations) during which resistant survivors re-seed heterogeneous populations. The scheme illustrates how each successive round of stress followed by recovery amplifies the relative numbers of cells in the more heterogeneous populations. This faster outgrowth of the heterogeneous strains is the same process that will favour any higher heterogeneity mutants that may spontaneously arise in the populations, ultimately leading to increased heterogeneity that is heritably stable.
