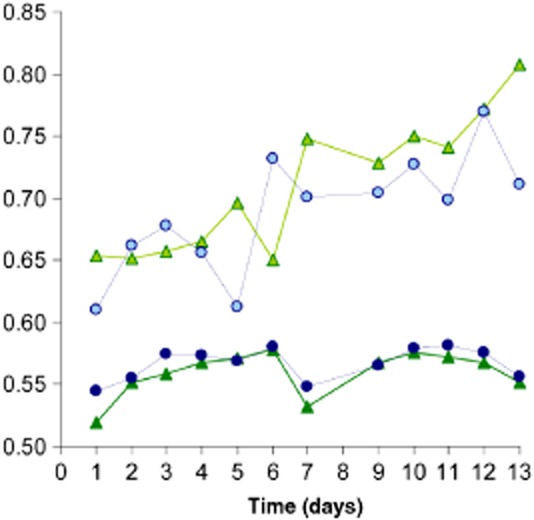
Figure 2.

Transition from isotropic to anisotropic biofilm clusters in contrasting flow environments. Green symbols refer to the clusters at the crest, and blue symbols refer to clusters in the trough; dark colours refer to cluster smaller than 130 μm2 considered as seeding material, and light colours refer to clusters larger than 131 μm2 subject to growth. The scaling exponent describes the relationship between cluster surface area and perimeter, and describes departure from isotropy (Supporting Information).
