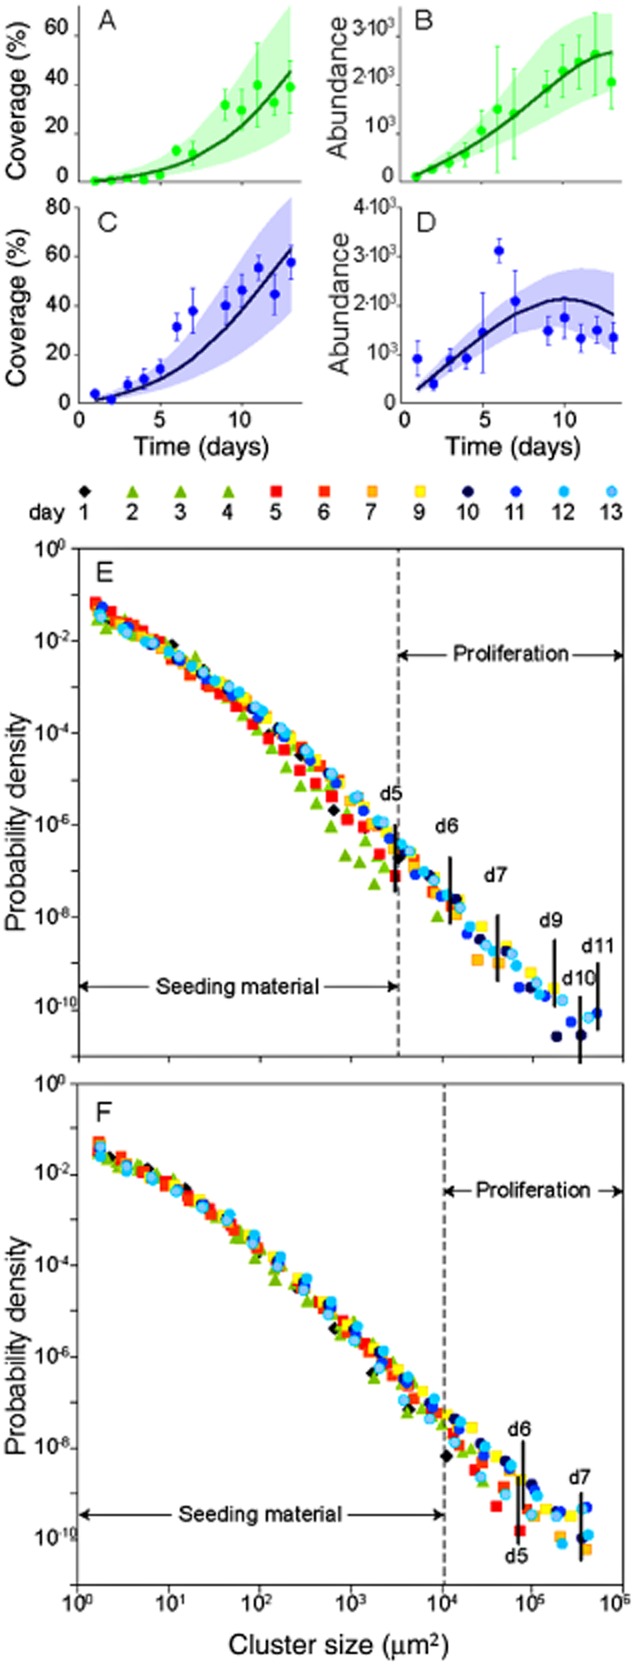
Figure 3.

Morphogenesis of biofilms in contrasting flow environments. Temporal dynamics of cluster abundance and coverage at the crest (A,B) and in the trough (C,D). Green and blue symbols refer to observed data, the solid line refers to the best-fit simulation of the model, and the shaded envelope refers to the confidence interval of the simulations. Cluster size distributions as probability density functions at the crest (E) and in the trough (F) for daily sampling points. Highlighted are days with clear shifts in cluster size distributions during proliferation. The size distribution of the seeding material remained largely constant during the growth period.
